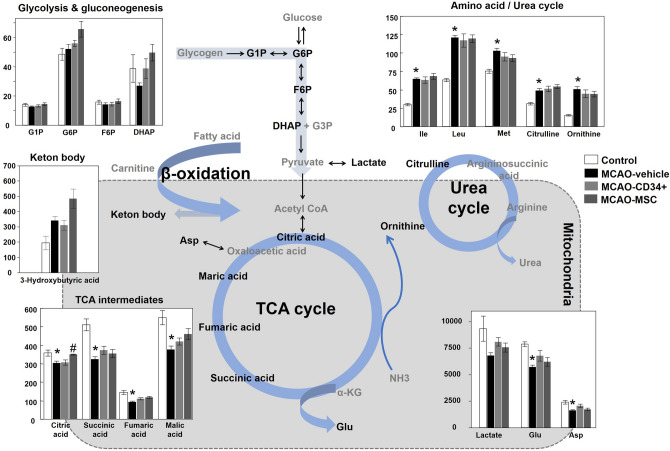
Figure 5.
Central metabolic pathway map and comparative visualization of involved metabolites after MCAO. Differences in the brain levels of metabolites among the control, MCAO-vehicle, MCAO-CD34+ cell, and MCAO-MSC groups are presented in a bar graph. MCAO decreased TCA intermediates and neurotransmitter metabolites, while MCAO increased metabolites from the amino acid and urea cycles. Data indicate the mean ± the S.E.M. of five mice for each group. *p < 0.05 versus the control group. #p < 0.05 versus the MCAO-vehicle group. G1P, glucose-1-phosphate; G6P, glucose-6-phosphate; F6P, fructose 6-phosphate; DHAP, dihydroxyacetone phosphate; G3P, glyceraldehyde 3-phosphate; Ile, isoleucine; Leu, leucine; Met, methionine; Glu, glutamate; Asp, aspartate; αKG, α-ketoglutaric acid; NH3, ammonia.

