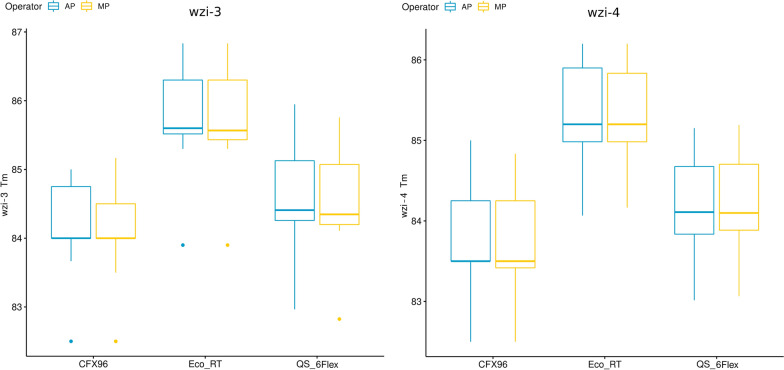
Fig. 1.
Boxplot of the wzi-3 and wzi-4 average melting temperatures. The distributions of wzi-3 and wzi-4 average melting temperatures (aTm) obtained by each instrument (“CFX96” for Biorad CFX96; “Eco_RT” for Illumina Eco Real-Time; “QS_6Flex” for Applied Biosystem QuantStudio 6 Flex) and operator (AP and MP; colored in blue and yellow, respectively) are shown. Boxes range between the 25th and the 75th quartiles, and bold horizontal lines represent the median values

