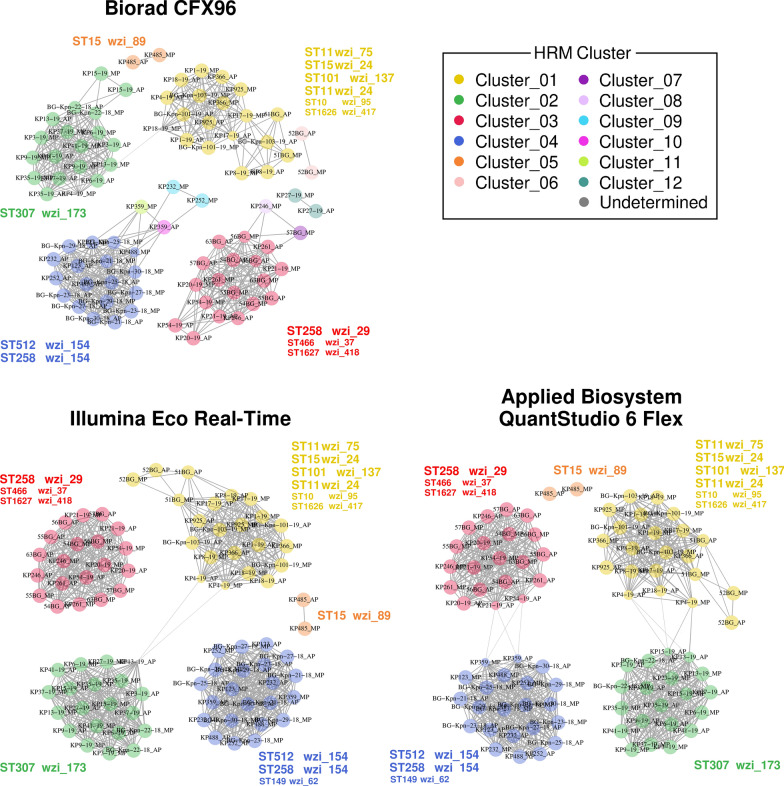
Fig. 2.
HRM-based strains clustering. The outputs of the MeltingPlot tool (Perini et al. 2020b) on the basis of wzi-3 and wzi-4 melting temperatures obtained by each of the three instruments included in the study (CFX96, ECO_RT and QS_6Flex) are shown. Two strains are connected if the average melting temperatures (aTm) for both wzi-3 and wzi-4 do not differ more than 0.5 °C. The strains clusters were identified by MeltingPlot tool on the basis of graph topology and highlighted by different colors. Genomic information (MLST profile and wzi allele) was added next to each major cluster in the corresponding color. The highly epidemiologically relevant Sequence Types (ST) (David et al. 2019; Wyres et al. 2019) are reported with a bigger font size

