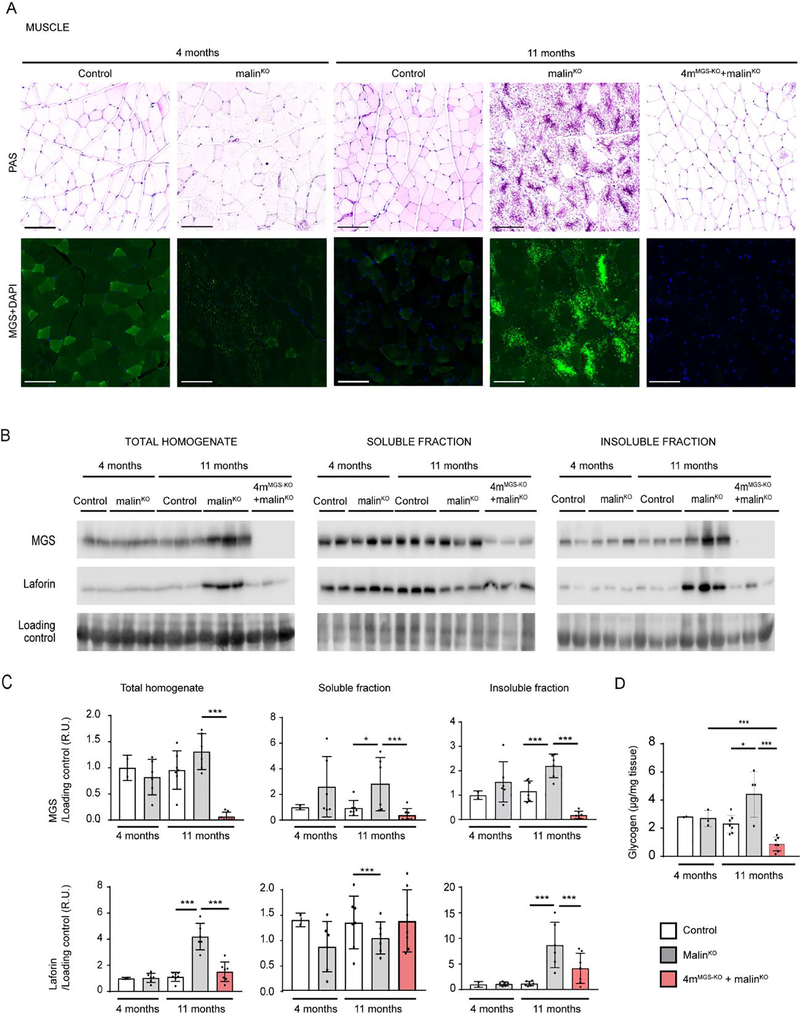
Figure 2.
MGS suppression in skeletal muscle. A. PAS staining. Representative images of quadriceps muscle stained with PAS (upper panels) and MGS (green) with DAPI (blue) (lower panels) for each experimental mouse group. Scale bar: 100 μm. B. MGS and laforin protein detection by western blot from total homogenates and soluble and insoluble fractions. Two representative samples for 4-month-old control mice and three representative samples for the other groups are shown in each western blot. Loading control: LICOR- revert staining. C. Quantifications of protein detected by western blot. Relative optical density (OD) units were related to loading control and normalized to the 4-month-old control group. D. Total glycogen measurement. Total amount of glycogen was determined in quadriceps muscles from animals in each experimental group (μg/mg tissue). In all the graphics each dot represents one mouse. Data are shown as mean±SD. n=2–7 mice per group as indicated. Statistics: Student’s t-test. *p≤0.05, ** p≤0.005, *** p≤0.001.

