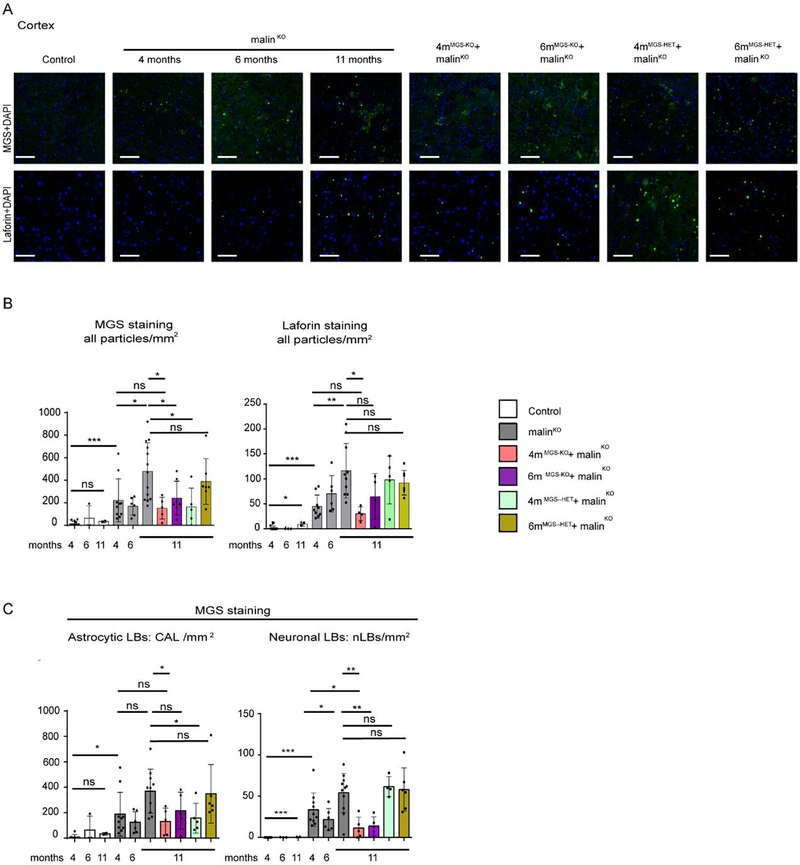
Figure 5.
LB quantification in the cortical prefrontal region. A. Cortical LB visualization by immunofluorescence. Representative images of the prefrontal cortex region (Cx) stained with anti-MGS (green, upper panels) and anti-laforin (green, lower panels) antibodies in combination with DAPI (blue) from each group. Scale bar: 100μm. B. Total number of particles detected in Cx from each brain by anti-MGS and anti-laforin antibodies stainings. Mean values between experiments are represented, a total of 3–4 non-consecutive sections were measured per brain for MGS and 4–6 non-consecutive sections for laforin. Each dot represents one mouse. Data are expressed as number of particles per mm2. C. Quantification of CAL and nLBs in the prefrontal cortex by MGS staining. Mean values between experiments are represented 3–4 sections were analyzed in each brain n=2–10 mice per group as indicated. Data are expressed as number of particles per mm2, shown as mean±SD. In all the graphics, each dot represents one mouse. Statistics: Student’s t-test test validated by by a linear mixed effect model analysis: *p≤0.05, ** p≤0.005, *** p≤0.001.

