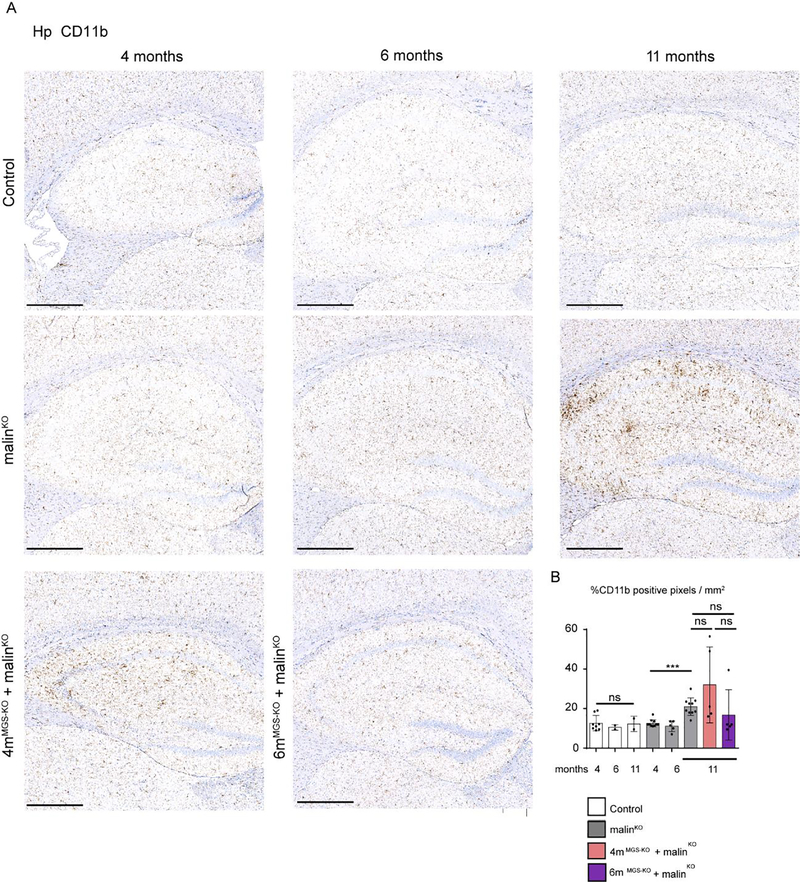
Figure 7.
Microgliosis in hippocampus by CD11b immunohistochemistry. A. Representative images of the Hp regions of each experimental group stained with anti-CD11b. Scale bar: 500 μm. B. Quantification of hippocampal microgliosis with CD11b staining. The percentage of CD11b positive pixels per area was quantified and represented as n of CD11b positive cells/mm2. Mean values and SD from serial analysis is shown. Data from 2–3 non-consecutive brain sections. Each dot represents one mice. Scale bar: 500 μm. Statistics: Student’s t-test test validated by a linear mixed effect model analysis: *p≤0.05, ** p≤0.005, *** p≤0.001.

