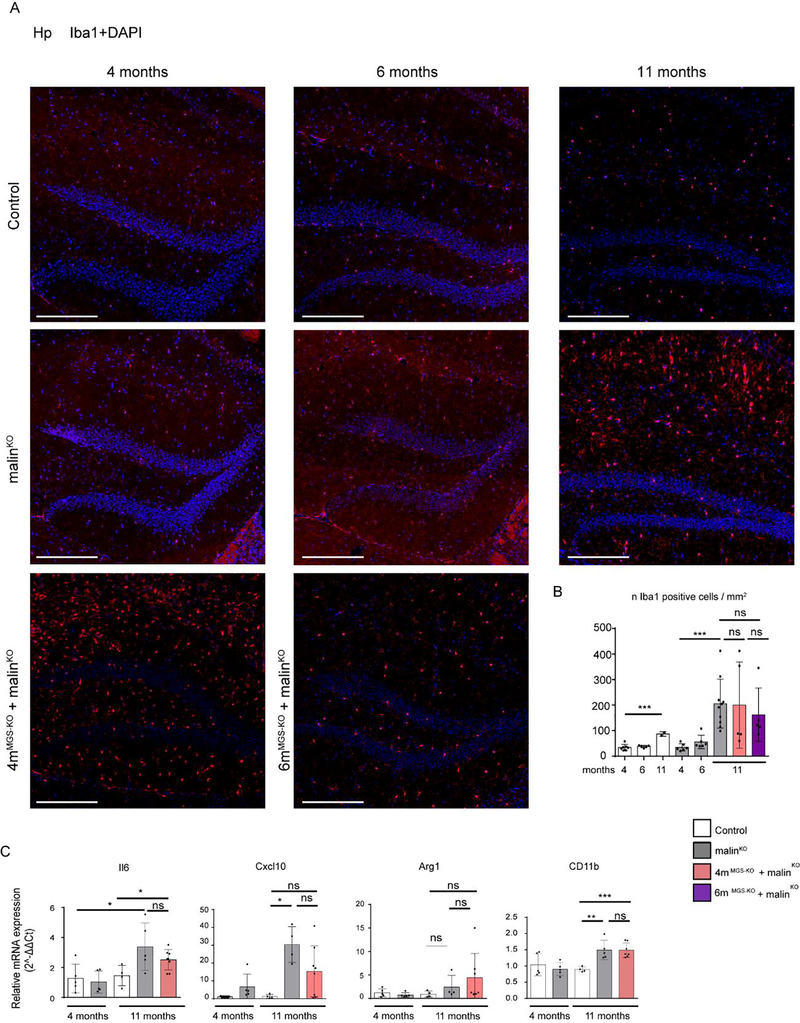
Figure 8.
Microgliosis in hippocampus by Iba1 inmunofluorescence and total brain qPCR analysis of inflammatory markers. A. Representative images of the dentate gyrus of Hp regions of each experimental group stained with anti-Iba1 antibody. Scale bar: 250μm. B. Iba1- positive cells were quantified by cell detection and represented as n cells /mm2. Mean values and SD from serial analysis are shown. Data from 2–4 non-consecutive brain sections and.n=2–8 mice as indicated. Statistics: Student’s t-test test validated by a linear mixed effect model analysis: *p≤0.05, ** p≤0.005, *** p≤0.001. C. RNA from total brain homogenate was obtained to analyze the expression of inflammatory genes by qPCR: IL6, CxCl10, Arg1and CD11b. Graphics show the relative expression levels (2-ΔΔCt). The b2M gene was used as housekeeping gene. Each dot represents one mice, n= 4–8 mice as indicated. Data shown as mean±SD. Statistics: Student’s t-test. *p≤0.05, ** p≤0.005, *** p≤0.001.

