
Figure 2.
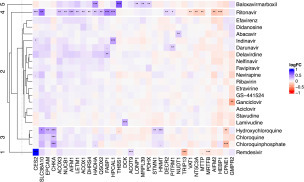
Heatmap of compound-induced protein thermal stability changes in HepG2 cells treated with different antiviral compounds. Proteins found to be significantly changed (p ≤ 0.01) in at least one compound are included in the plot.
Official websites use .gov
A
.gov website belongs to an official
government organization in the United States.
Secure .gov websites use HTTPS
A lock (
) or https:// means you've safely
connected to the .gov website. Share sensitive
information only on official, secure websites.
Heatmap of compound-induced protein thermal stability changes in HepG2 cells treated with different antiviral compounds. Proteins found to be significantly changed (p ≤ 0.01) in at least one compound are included in the plot.