
Figure 3.
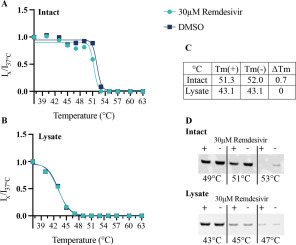
Western blot CETSA analysis of remdesivir destabilization of TRIP13 Band intensities of TRIP13 melt curves ± 30 µM remdesivir on (A) intact HepG2 cells and (B) lysed HepG2 cells. (C) Table representing apparent Tm values and delta Tm shift. (D) Western blots representing a selection of temperatures form the complete melt curves for both intact and lysate samples. Band corresponding to correct molecular weight for TRIP13.