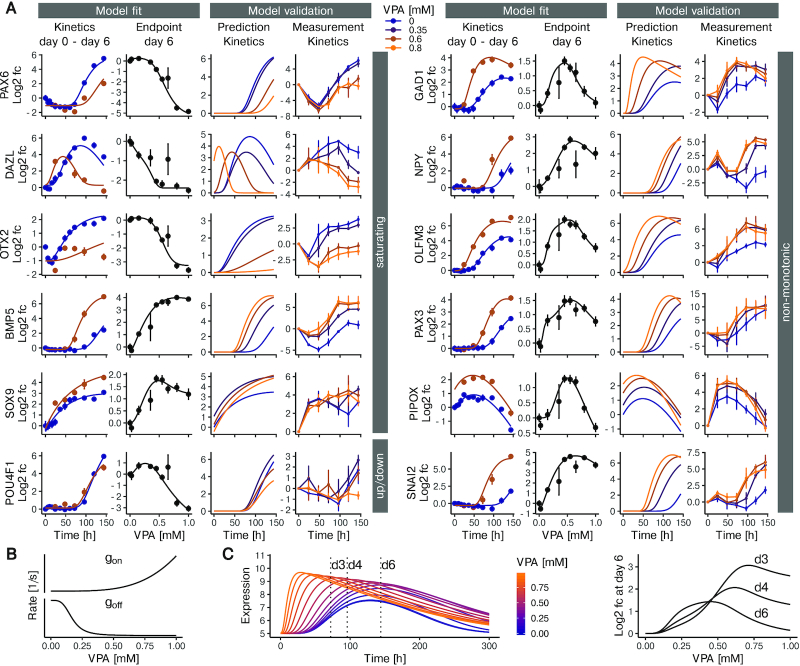
Figure 3.
Multi-state model-based predictions of gene expression under the influence of VPA. (A) Model fit and experimental validation for genes with different types of concentration-response behavior. The left panel shows examples of genes with largely monotonic concentration-response behavior. The right panel exemplifies non-monotonic responses. For each gene, the first column (from left to right) shows the experimental data (means ± standard deviation) together with the model fit for the time-dependent expression in the presence of 0 (blue) or 0.6 mM (brown) VPA. Next, the concentration-response data for 6 days of VPA exposure are shown together with the model fit. The third column indicates the model predictions for gene expression kinetics at VPA concentrations of 0, 0.35, 0.6 and 0.8 mM. The fourth column shows expression kinetics data from a validation experiment using RT-PCR (means ± SD, n = 3). The concentrations were 0, 0.35, 0.6, 0.8 mM (blue to orange). (B, C) Detailed exemplification of non-monotonic concentration-response behavior predicted by the model for the GAD1 gene. The graphs in B show how the VPA concentration affects the production rate (gon) and the decay rate (goff). Both rates change monotonically with the VPA concentration. (C) The left plot shows the computed model prediction of gene expression over time, at VPA concentrations increasing from blue to orange (range: 0–1 mM). The peak concentration not only increases with increasing VPA concentration, but also moves to earlier time points. The plot to the right shows fold changes in gene expression based on the data on the left, for a time of 72, 96 and 144 h and for various VPA concentrations versus control.

