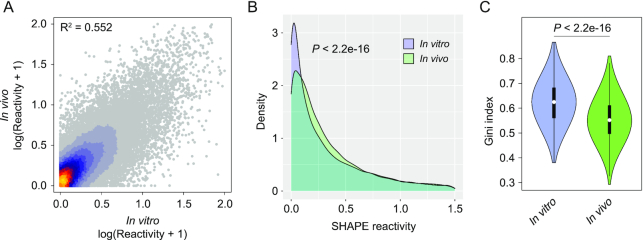
Figure 2.
Comparison between in vitro and in vivo structure of the SARS-CoV-2 genome. (A) Heat scatter plot of normalized SHAPE reactivities for the in vitro refolded SARS-CoV-2 genome versus the in vivo-probed one. (B) Distribution of SHAPE reactivities for the in vitro refolded SARS-CoV-2 genome, versus the in vivo-probed one. (C) Violin plot depicting the distribution of Gini indexes calculated in 50 nt windows slid along the SARS-CoV-2 genome for the in vitro refolded sample versus the in vivo-probed one (sliding offset: 25 nt).

