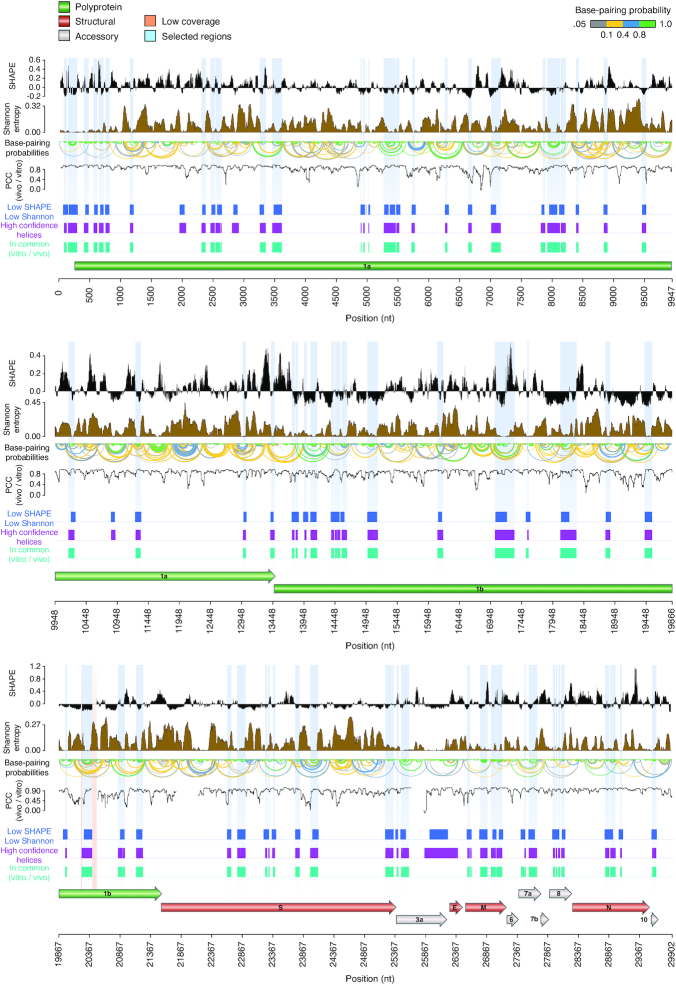
Figure 4.
Structure map of the full SARS-CoV-2 genome in vivo. Map of the SARS-CoV-2 genome depicting (top to bottom): median SHAPE reactivity (in 50 nt centered widows, with respect to the median reactivity across the whole genome), Shannon entropy, base-pairing probabilities, Pearson correlation coefficient (in 50 nt centered windows; PCC) between in vitro and in vivo SHAPE data, set of low SHAPE – low Shannon under both in vitro and in vivo conditions (blue), set of helices coherently predicted independently of the window size employed (3000, 5000 or 10 000 nt; magenta), set of helices coherently predicted under both in vitro and in vivo conditions (aqua green). Selected structure elements are marked in light blue. Two short regions of low sequencing coverage are marked in red.

