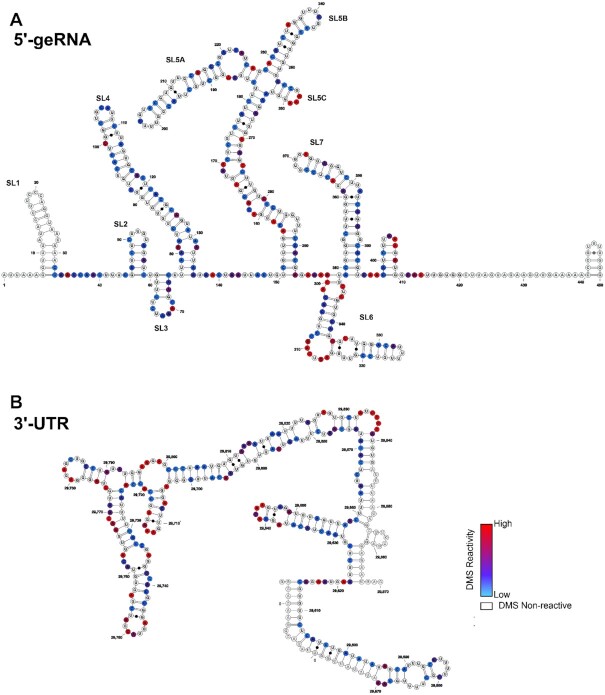
Figure 2.
Secondary structures of the SCoV2 5′-genomic end and 3′-UTR as determined by DMS-MaPseq. Normalized DMS reactivity indices used to fold the secondary structures of (A) SCoV2 5′-genomic end and (B) SCoV2 3′-UTR are superimposed with color codes scaled from the highest reactivity set to 1 (red) to the lowest set to 0 (blue). G and U nucleotides are rendered as white and sites that overlap with sequencing primers are rendered transparent.

