
Figure 9.
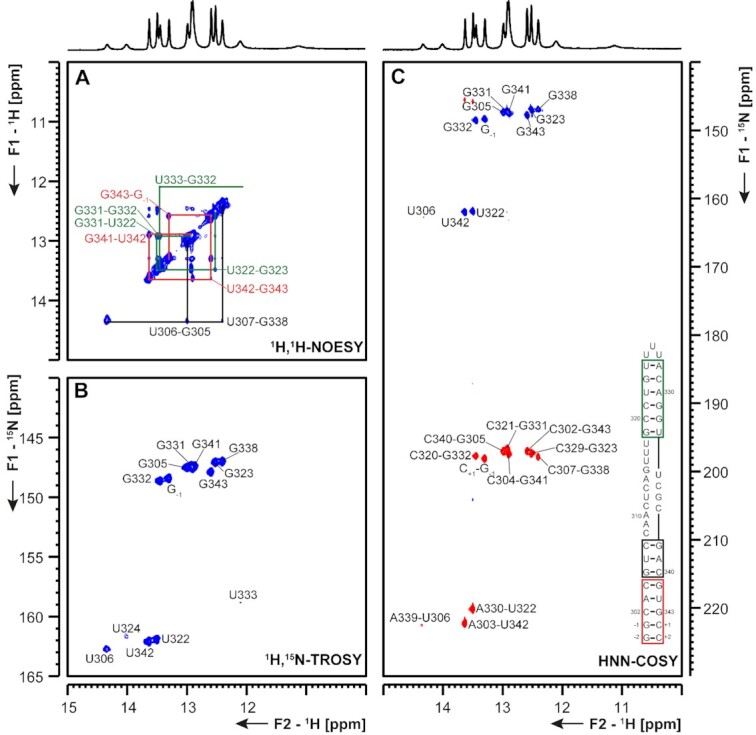
(A) 1H,1H-NOESY, (B) 1H,15N-TROSY and (C) HNN-COSY spectra for imino-proton correlation of the 5′-genomic end construct 5_SL6 encompassing nts 302–343. Positive contours are given in blue, negative contours in red. The imino-proton correlations are annotated using the genomic numbering. Imino-proton correlations in (A) between consecutive base pairs are shown in different colors. Included in (C) is the experimentally observed secondary structure of 5_SL6 with genomic numbering. Additional closing base pairs are annotated with ‘±x’. Colors of boxes are according to the correlations in (A).