Figure 7.
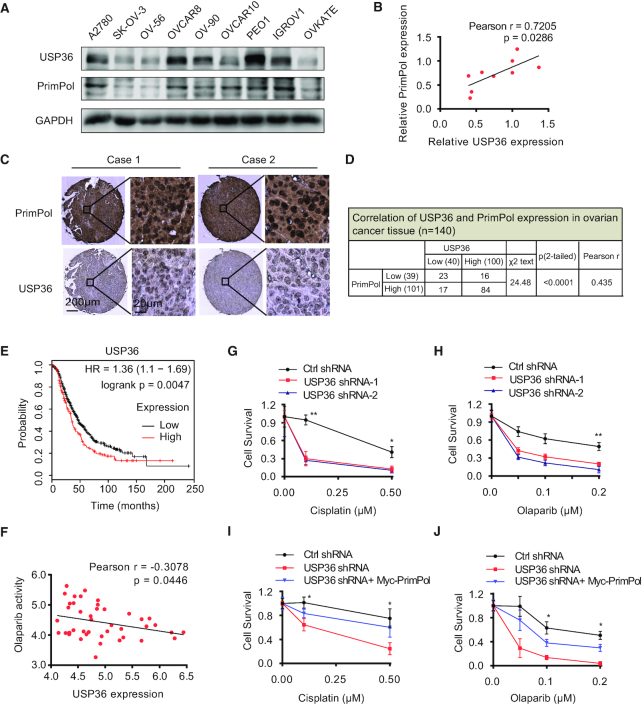
USP36 expression is correlated with PrimPol levels in ovarian cancer, and regulates the treatment response of cancer cells through PrimPol stabilization. (A) Cell lysates from several ovarian cancer cell lines were blotted with USP36 and PrimPol antibodies. (B) Correlation analysis of USP36 and PrimPol in ovarian cancer cells. Statistical analyses were performed with the χ2 test. The Pearson r indicates correlation coefficient. (C) Representative images of immunohistochemical staining of USP36 and PrimPol on tissue microarray of ovarian cancer specimens (n = 140). Scale bars are indicated. (D) USP36 expression correlates with PrimPol levels in tissue microarray of ovarian cancer samples. Protein levels of USP36 and PrimPol were quantified in ovarian cancer specimens. Statistical analyses were performed with the χ2 test. (E) Survival analysis of ovarian cancer patients by the Kaplan–Meier Plotter. (F) Negative correlation between olaparib activity and USP36 expression in 43 ovarian cancer cells using CellMinerCDB. (G-H) Control and OVCAR8 cells with USP36 stably knock-down from Supplementary Figure S7A were subjected to cisplatin or olaparib treatment. Survival of the cells was assessed by colony formation assay. (I, J) OVCAR8 USP36-knockdown cells reconstituted with Myc-PrimPol from Supplementary Figure S7B were subjected to cisplatin or olaparib treatment. Survival of the cells was assessed by colony formation assay. Error bars represent ± SD from three independent experiments. *P < 0.05; **P < 0.01.

