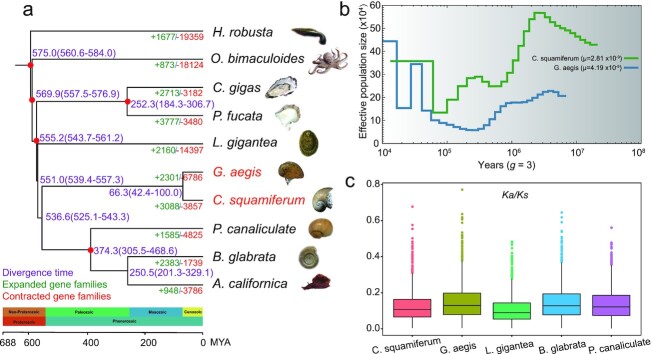
Figure 2:
Phylogenetic tree, estimated Ne, and evolution of single-copy orthologous genes of deep-sea snails. a, Phylogenetic tree of 10 representative molluscs. Expanded and contracted gene families were identified using CAFE. Divergence time was estimated using MCMCtree. Species names in red represent 2 deep-sea snails. Red dots represent calibration time from TimeTree database. Purple ranges in parentheses denote 95% CI(confidence interval).The timescale also refers to the TimeTree database. b, Estimated demographic histories of 2 deep-sea snails. The generation time set to “3” refers to the land snail [20]. The μ values are calculated in Supplementary Table S15. c, Box plot of Ka/Ks values for 5 species.

