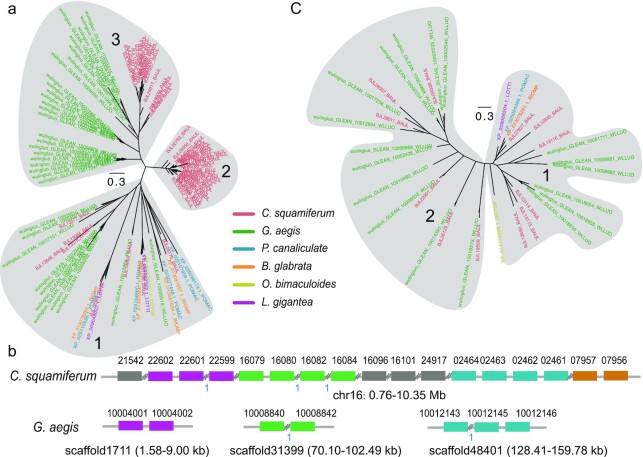
Figure 3:
Expansion of nervous system–related genes. a, Phylogentic tree of BTBD6 genes in the examined species. The grey ellipses mark different clusters of genes. b, Expansion pattern of BTBD6 genes in 2 deep-sea snails. Grey lines represent scaffold sequences. Coloured rectangles represent BTBD6 genes. Symbols “//” represent other genes along the scaffolds. The blue numbers “1” represent only 1 gene between the tandem duplicated genes. c, Expansion of HTR4 genes. The species legend in the middle applies to a and c. Gene trees of a and c were constructed using MUSCLE (v3.8.31) [72] and FastTree (v2.1.10) [27].

