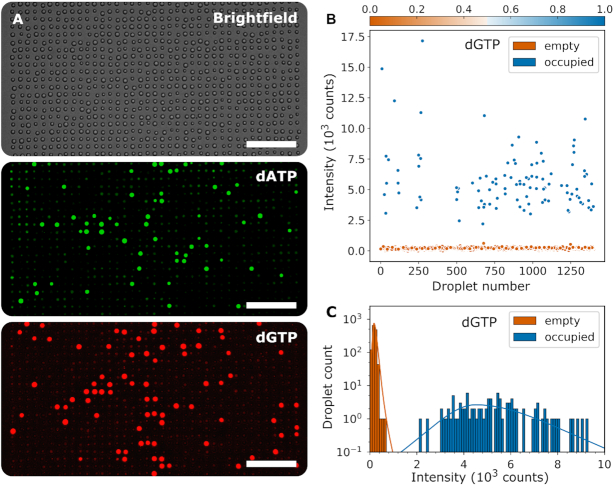
Figure 4.
Example fluorescence data from DNA sequencing workflow. Data produced from the pUC19 fragment (A) Fluorescence images of a section of the microdroplet array in the dATP and dGTP channels. A brightfield image is also shown for reference. Scale bars are 100 μm. (B) Droplet intensity plotted against the order in which droplets were passed over DNA, extracted from the dGTP channel. Points are coloured by probability of dGTP presence. From this data for each channel, a histogram (C) can be plotted showing frequency of occurrence versus droplet intensity. Two peaks are visible, one for droplets which contain no nucleotide (orange, <50% occupancy probability) and one for droplets which contain one (or more) nucleotides (blue, ≥50% occupancy probability). For each of the subfigures, the data for all dNTP channels is included in the Supplementary Information (Supplementary Figures S6–S8).

