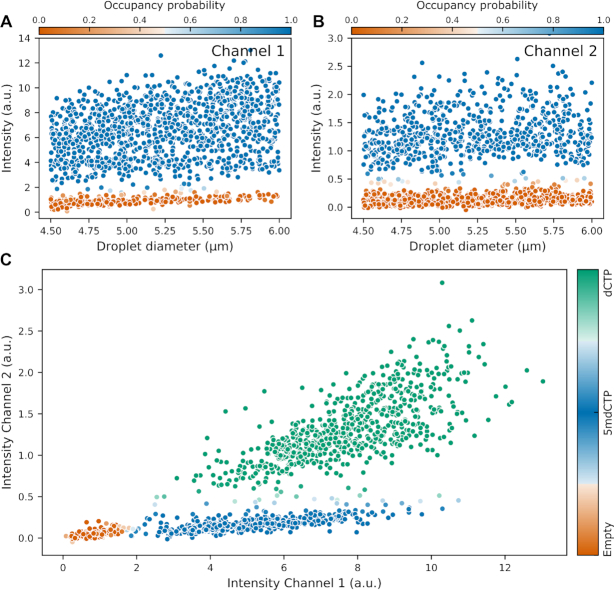
Figure 6.
Demonstration of 5-methylcytosine detection. Droplet intensity plotted against droplet diameter, extracted from: (A) Channel 1 which fluoresces when either dCTP or 5mdCTP is present, and (B) Channel 2 which shows high intensity only when dCTP is present. Points are coloured by probability of nucleotide presence. A plot of droplet intensity in Channel 1 versus Channel 2 (C) allows clustering of the droplets according to their contents. The population coloured orange contains no nucleotide, blue indicates the droplets contain only 5mdCTP, and green indicates the droplets contain dCTP. The shading is based on the probabilities of nucleotide presence from subplots A and B.

