
Figure 4.
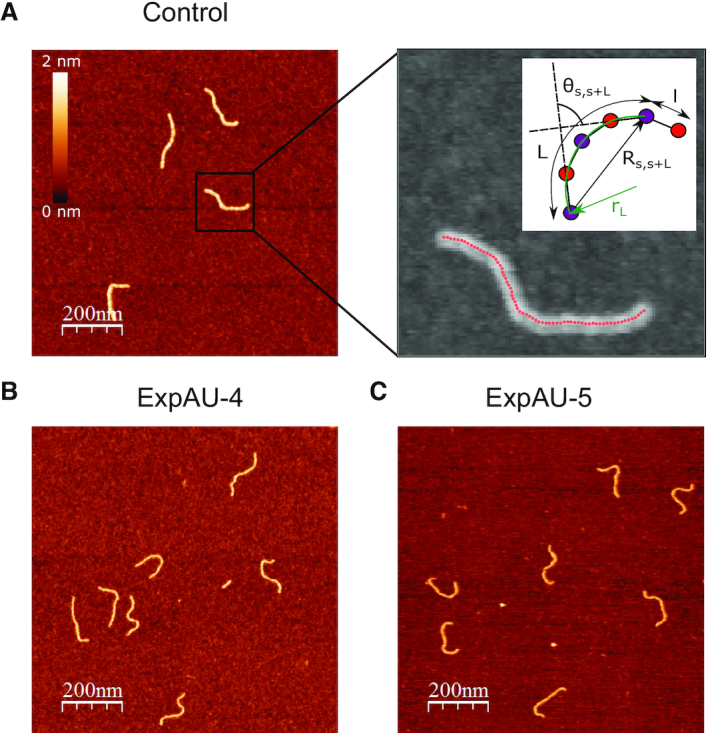
AFM images of control and AU-tract dsRNA sequences. (A) Representative AFM image of control molecules with a zoom-in image of the marked region showing an example of a typical trace. Additional AFM images are shown in Supplementary Figure S7. Inset, cartoon depicting a segment of a trace. In black, we represented the end-to-end distance,  , between two points separated by a contour distance
  15 nm and the angle defined by the tangents at those points,
 . Those same points are considered together with a third, middle point located at
  7.5 nm from each of them (purple points) to fit a circle of radius
  (in green). The distance between two adjacent points of the trace is
  2.5 nm. (B) Representative AFM images of ExpAU-4 and (C), ExpAU-5 molecules. Z-scale is the same as in A.