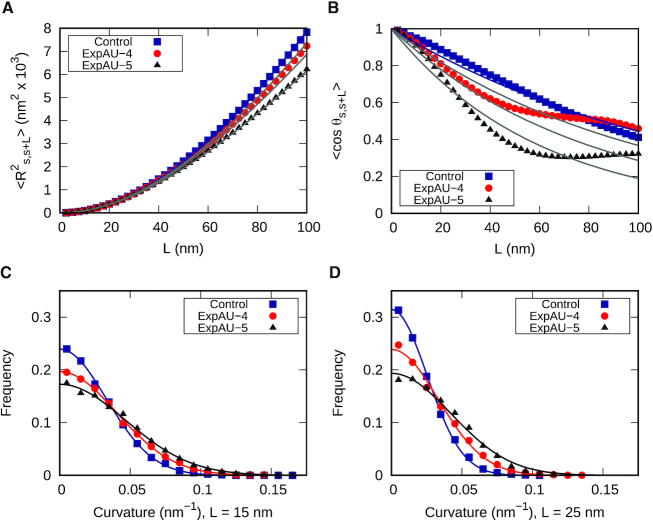
Figure 5.
Experimental quantification of dsRNA bending induced by AU-tracts. Mean squared end-to-end distance (A) and mean cosine of the tangents (B) plotted as a function of the contour distance between two points. The blue solid line is a fit of the control data to the WLC equations (Equation (1) for panel A, and Equation (2) for panel B), which yielded  66 ± 1 nm and
  62 ± 1 nm for the
  and
and  data, respectively. To guide the eye, theoretical WLC curves are included with persistence lengths of 30, 40 and 50 nm (bottom-up in both panels). Histograms of curvature distributions for fixed contour lengths of 15 nm (C) and 25 nm (D), showing the relative frequency of different curvature values. The distributions were fitted to Gaussian functions (solid lines). The standard deviation parameters obtained from these Gaussian fits are presented in Table 2.

