Figure 3.

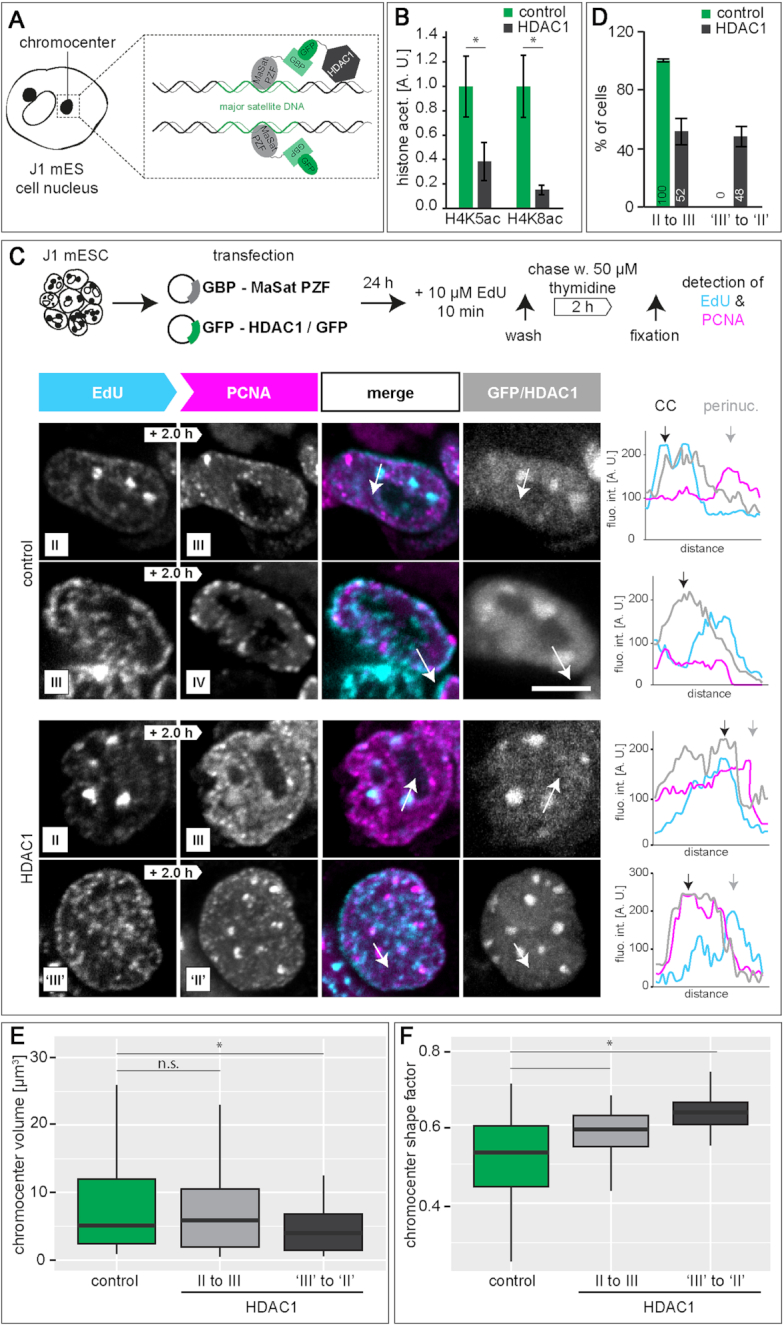
HDAC1 deacetylase targeting to chromocenters in mouse embryonic stem cells. (A) Schematic representation of the targeting strategy to recruit HDAC1 to chromocenters. In a targeted state, the fusion protein composed of the major satellite binding MaSat PZF (MaSat) and GFP binding protein (GBP) recruits the GFP-HDAC1 fusion protein to chromocenters via binding of the GBP to GFP. In the control experiments, only GFP was recruited to chromocenters. (B) Histone acetylation (H4K5ac and H4K8ac) levels in (HDAC1) targeted and GFP control cells (mean ± StDev). (C) 24 h after double transfection of J1 mES cells, cells were pulse chased as described in Figure 1. Representative spinning disk confocal images from GFP control cells showing S-phase substage transitions from stage II to III and from stage III to IV and from HDAC1 targeted cells showing transitions form stage II to III and from stage ‘III’ to ‘II’. Line profiles represent fluorescence intensities along the arrow marked in the images. CC = chromocenter, perinuc. = perinucle(ol)ar. (D) Percentages of cells representing stage II to III and stage ‘III’ to ‘II’ transitions in control and targeted cells (mean ± StDev). (E-F) Chromocenter volume (E) and chromocenter shape factor (F) in control cells and cells showing stage II to III and stage ‘III’ to ‘II’ transitions in HDAC1 targeted cells. *P < 0.05 and n.s. = non-significant. Detailed statistics are summarized in Supplementary Table S8. Scale bar = 5 μm.
