
Figure 4.
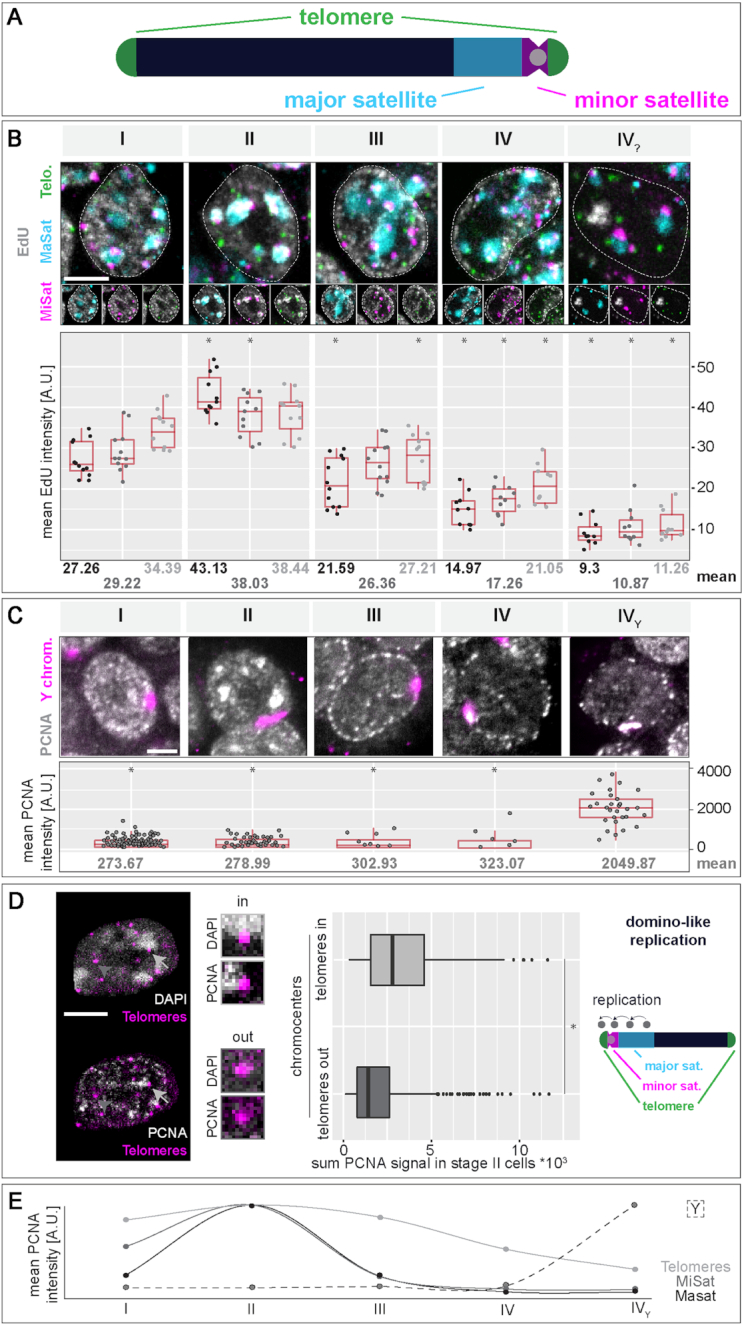
Replication timing of (sub)-chromosomal structures in mouse embryonic stem cells. (A) Schematic representation of a mouse acrocentric chromosome. Centromeric satellite regions (MiSat) and flanking pericentromeric DNA (MaSat) are depicted in magenta and cyan, respectively and telomeres are shown in green. (B) Tandem repeat elements were co-visualized with EdU (labeling of nascent DNA, grey) in mES cell interphase nuclei by triple FISH hybridization. Cells were classified into S-phase stages I to IV? according to their EdU pattern, mean EdU intensities within the marked elements were measured as described in Supplementary Figure S3 and plotted. Mean values are indicated below each plot. (C) Analysis of Y chromosome FISH in combination with PCNA staining was performed as in (B). (D) Analysis of telomere replication timing in J1 mES cells co-stained for PCNA and telomeres. Chromocenters of S-phase stage II cells were segmented according to the DAPI staining, and sum values of PCNA fluorescent intensity were measured within segmented telomeres located in close proximity to chromocenters (light grey arrows, ‘telomeres in chromocenters’) and within telomeres located on the long arm of the chromosome (not in proximity of chromocenters, dark grey arrow heads, ‘telomeres out of chromocenters’). Replication of chromocenter near telomeres within S-phase stage II hints towards a domino-like replication model with a sequential order of replication of adjacent chromosomal regions (MaSat/MiSat to telomeres on the short chromosome arm). (E) Summary of the replication timing of tandem repeat elements and the Y chromosome in mES cells. (Peri)centromeric DNA regions (MaSat and MiSat) are mainly replicated within the first half of S-phase (stage II), telomeres are replicated throughout S-phase and the Y chromosome marks the end of S-phase (stage Y). Dotted lines represent cell contours. Boxplots are as in Figure 2 and Supplementary Figure S7. Scale bar = 5 μm. Detailed statistics are summarized in Supplementary Table S10. *P < 0.05 (calculated among each elements against the respective stage I value (B) or against stage Y in C).