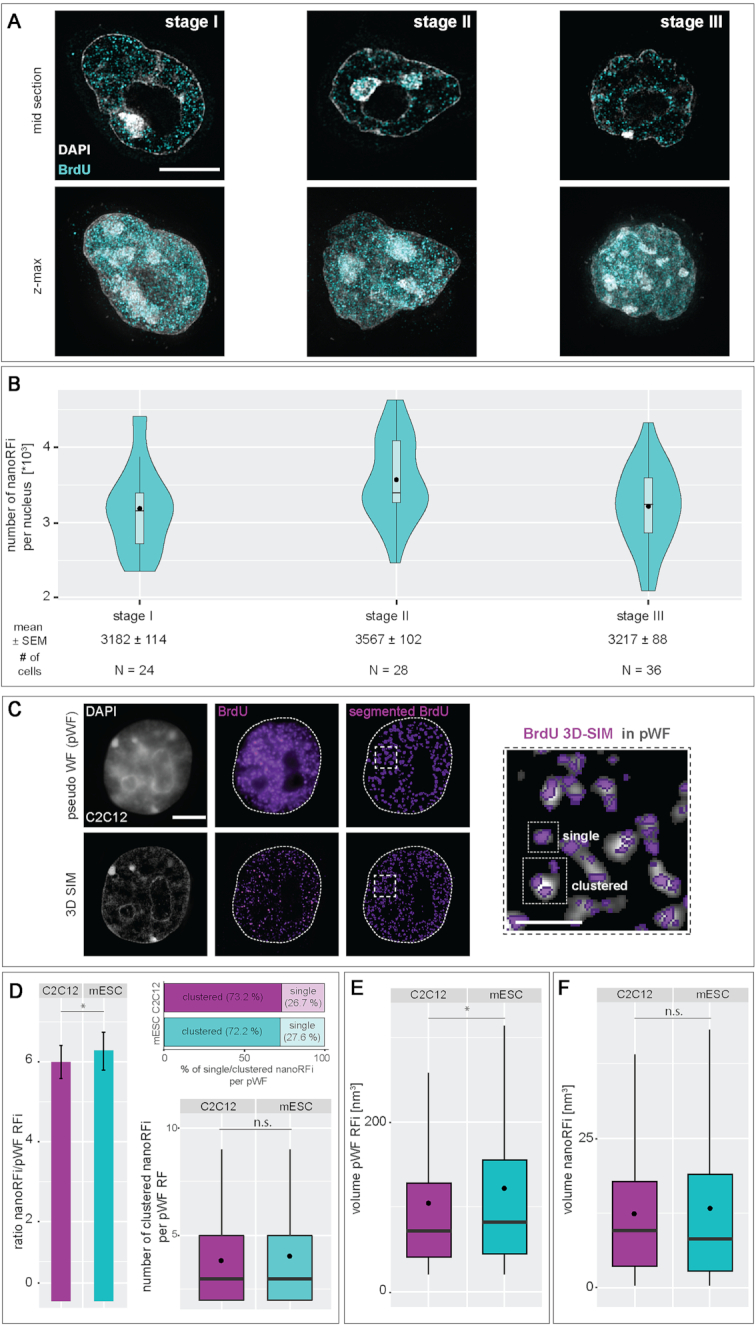
Figure 6.

3D quantification and analysis of replication foci throughout S-phase in mouse embryonic stem cells. (A) Mid sections and maximum intensity z-projections (z-max) of 3D structured illumination microscopy (3D-SIM) images of mouse ES cells representative of the first three S-phase patterns (I–III) are shown. (B) Numbers (mean ± SEM) of nano replication foci (nanoRFi) quantified as described in Supplementary Figure S4 are plotted separately for each of the three S-phase patterns. N indicates the number of cells analyzed. (C) At lower optical resolution, replication signals appear as larger foci (pseudo wide-field (pWF) foci). These can be resolved to a number of smaller foci when imaged by super-resolution microscopy. Shown are representative pWF (upper row) and the respective 3D SIM images (lower row) of the cell nucleus of a mouse myoblast, the unsegmented (middle column) and segmented (right column) BrdU replication signals. The pWF replication foci were segmented as described in Supplementary Figure S5 and used to demarcate a distinct volume of DNA in which the number of nano replication foci (nanoRFi) was quantified (magnified inset). nanoRFi are considered as ‘clustered’ if one pWF focus contains more than one nanoRFi. (D) Results of cluster analysis of nanoRFi within the distinct volume of a pWF replication focus are shown. RFi ratios from super-resolution versus pseudo-widefield microscopy (barplot ± Stdev) and analysis of the number of clustered nanoRFi in individually segmented pWF foci (boxplot) in early S-phase mouse ES and myoblast (C2C12) cells are shown. Percentages of single and clustered nanoRFi are depicted. (E-F) Volumes of the segmented pWF (E) and 3D-SIM (F) nano replication foci (nanoRFi) are shown. Detailed statistics are summarized in Supplementary Table S12. Boxplots are as in Figure 2. * P < 0.05 and n.s. = non-significant. Black dots within violin/box plots represent mean values. Scale bar = 5 and 2.5 μm for main graphs and magnified regions, respectively. Brightness and contrast of 3D-SIM images were adjusted for every image depicted. Dotted lines represent cell contours.
