Figure 7.
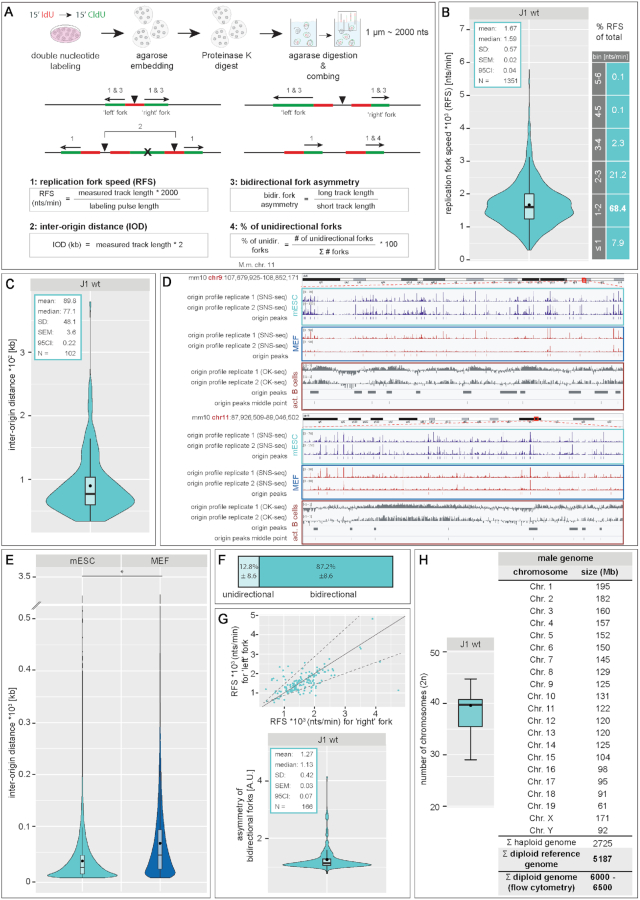
DNA replication fiber and genome size analysis in mouse embryonic stem cells. (A) Schematic outline of the experimental setup for DNA fiber analysis. mES cells were sequentially labeled with IdU and CldU for 15 min, harvested and embedded in agarose. After a proteinase K digestion step, agarose was digested and high molecular weight naked DNA was stretched on silanized glass coverslips. Nucleotide analogs and single stranded DNA (ssDNA) were immunofluorescently detected. (B–E) The length of fluorescent tracks of the second pulse (CldU) were measured (1 μm ∼ 2000 nucleotides, Supplementary Figure S6) and the mean replication fork speed (RFS, (B)), inter-origin distance (IOD, (C)), percentage of unidirectional forks (F) and asymmetry of bidirectional forks (G) were calculated as indicated in (A). Additionally, the percentages of forks within a given range of RFS are indicated in (B). For comparison of the RFS of the ‘left’ and ‘right’ fork of a bidirectional fork, RFS values were plotted in a scatterplot. The solid grey line represents the linear relation x = y and dotted lines represent thresholds allowing for a 35% (± StDev calculated for the asymmetry factor) difference between lengths of the two forks. (D) Visual representation of origin mapping in two arbitrarily selected regions (mouse (Mus musculus, mm10) chromosomes 9 and 11). SNS-seq origin profiles and identified origins in mES and MEF cells are shown. OK-seq origin profiles in activated (act.) B cells, called peaks along with the middle point of each peak are represented. Replication profile scale is indicated in the upper left corner. The comparison between identified and clustered origin peaks is shown in Supplementary Figure S20. (E) IOD distributions based on the genome-wide origin maps in mES cells and mouse embryonic fibroblast (MEF) are shown (SNS-seq). The sequencing datasets used for the analysis include two independent replicates of origin mapping for each condition. (H) Ploidy of J1 mES cells was determined via karyotype analysis of metaphase spreads. For genome size calculation, the sizes of individual mouse chromosomes (19 autosomes + X and Y chromosomes) were retrieved from the Genome Reference Consortium database. Additionally, genome sizes measured by flow cytometry are indicated. Boxplots/violinplots are as in Figure 2 and Supplementary Figure S7. Statistical details are depicted in the plots or summarized in Supplementary Table S13. All experiments were done in at least two independent biological replicates. Black dots within box/violin plots represent mean values. * P < 0.05. Scale bar = 5 μm.

