Figure 1.
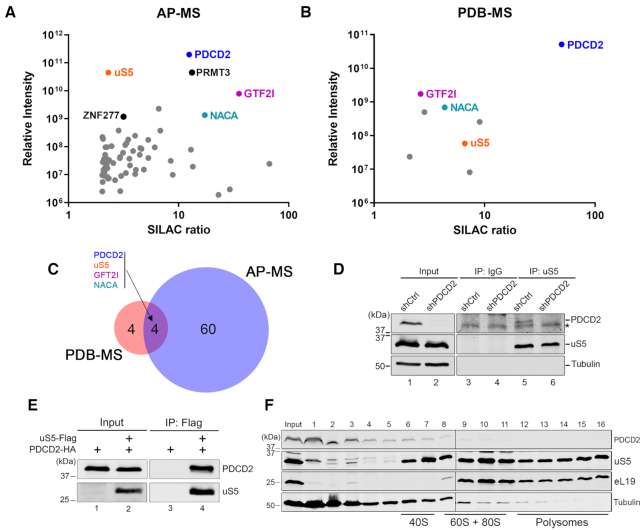
PDCD2 forms a complex with the free uS5 protein in human cells. (A) Scatterplot showing results from GFP-PDCD2 affinity purification-coupled to mass spectrometry (AP-MS) plotted by SILAC ratio on the x-axis (peptide intensity originating from the GFP-PDCD2 purification versus the GFP control), which reflects specificity; and relative peptide intensity up the y-axis (total peptide intensity for each protein), reflecting the relative abundance of each protein in the purification. (B) Scatterplot showing results from proximity-dependent biotinylation (PDB) assay using BirA-PDCD2 coupled to SILAC-based mass spectrometry (MS) quantifications, as described in (A). (C) Venn diagram showing overlap between PDCD2-associated proteins identified by AP-MS (n = 64) and PDB-MS (n = 8). (A–C) The four proteins common to AP-MS and PDB-MS are shown in color. (D) Western blot analysis of cell extracts (lanes 1–2) as well as uS5 (lanes 5–6) and IgG (lanes 3–4) immunoprecipitates prepared using extracts from HeLa cells that conditionally express control (lanes 1, 3 and 5) and PDCD2-specific (lanes 2, 4 and 6) shRNAs. Antibodies used for Western blotting are indicated on the right. The asterisk (top panel) indicates the presence of a non-specific protein detected using the PDCD2 antibody. (E) Western blot analysis of total extracts (Input, lanes 1–2) and anti-Flag precipitates (IP, lanes 3–4) prepared from E. coli that co-expressed PDCD2 and uS5 (lanes 2 and 4) or that expressed PDCD2 alone (lanes 1 and 3). (F) Western analysis of the indicated proteins (right) using fractions of centrifuged sucrose gradients that were prepared using extracts of HeLa cells. The positions of the 40S, 60S/80S, and polysomes sedimentation are indicated at the bottom.

