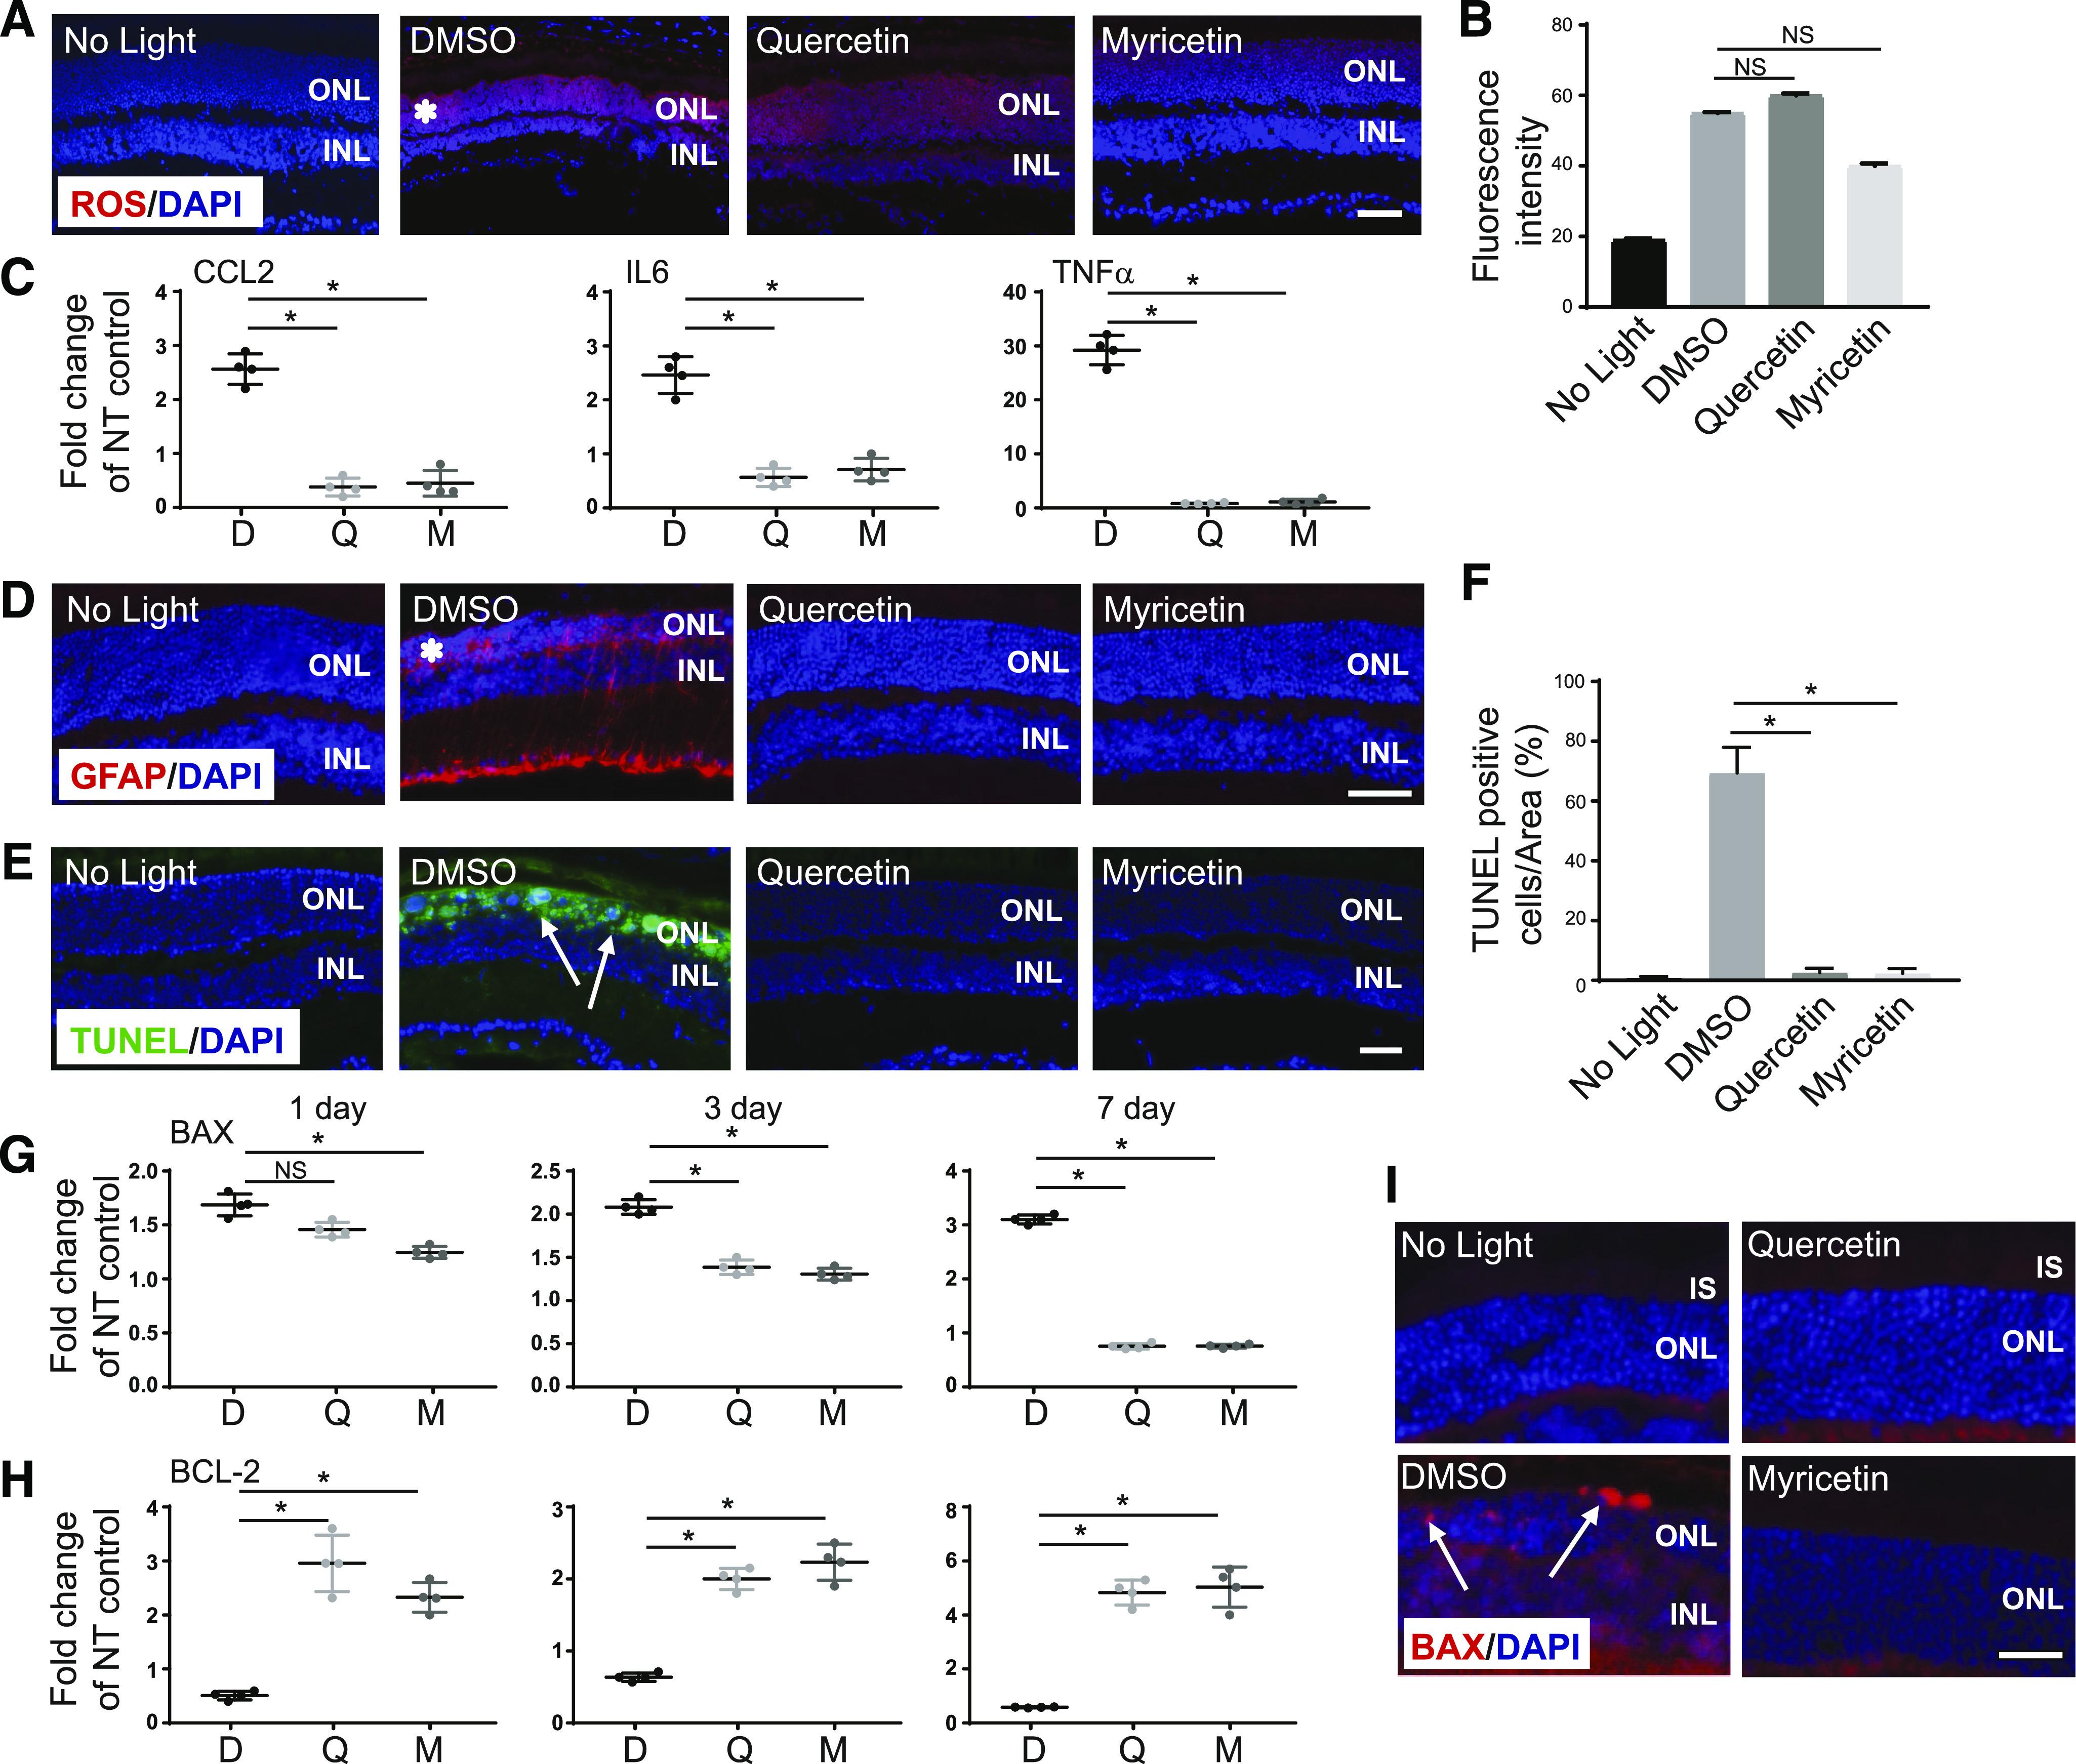
Fig. 5.

The effect of flavonoids on ROS generation and levels of inflammatory and apoptotic markers in eyes of Abca4−/−Rdh8−/− mice exposed to bright light. (A) Mice treated either with DMSO vehicle or flavonoid prior to exposure to 10,000-lux light or unexposed mice were injected intraperitoneally with a DHE probe 1 day after illumination. Eyes were collected 1 hour later, fixed, and processed by cryo-sectioning. The red fluorescent signal indicates ROS accumulated in the retina. Staining with DAPI (blue) was used to visualize nuclei. Scale bar, 50 µm. (B) Quantification of fluorescence intensity obtained from different regions of photoreceptor cell layers is presented as mean and S.D. The changes in the fluorescence intensity detected in the retina of mice treated with either quercetin or myricetin as compared with DMSO-treated and illuminated mice were not statistically different, which is indicated as NS. No changes in the fluorescence intensity were detected in the retina of mice treated with quercetin. Statistical analysis was performed with the one-way ANOVA and Dunnett’s post hoc tests. (C) RT-qPCR was performed to determine the mRNA expression levels of genes implicated in inflammation. Eyes were collected from unilluminated mice and mice treated either with DMSO vehicle or flavonoid prior to illumination on day 7 post-treatment. Twenty mice were used, with at least four mice for each treatment group. Total RNA was isolated from collected mouse eyes. RT-qPCR detecting the expression levels of CCL2, IL6, and TNFα was performed with specific primers. Relative fold change of these genes’ expression was normalized to the expression of GAPDH. The mean of data from three independent experiments is shown as the fold change of NT control. The expression of inflammatory markers was upregulated in DMSO-treated and exposed-to-light mice, whereas upon treatment with flavonoids it was significantly downregulated. The statistically different changes in the expression of the specific gene (CCL2, IL6, or TNFα) compared between DMSO-treated control and flavonoid-treated mice are indicated with asterisk (*). Error bars indicate S.D. Statistical analysis was performed with the one-way ANOVA and Dunnett’s post hoc tests. (D) Eye cryo-sections (8 μm–thick) were stained with an antibody against GFAP, a microglia activation marker (red). Nuclei were stained with DAPI (blue). Scale bar, 50 µm. GFAP positive staining was increased in DMSO-treated and light-exposed mice as compared with unilluminated mice. Treatment with flavonoids significantly reduced microglia activation induced by bright-light insult. (E) TUNEL staining performed in eye cryo-sections showed dying photoreceptors (green). Nuclei were stained with DAPI (blue). Scale bar, 50 µm. (F) Quantification of TUNEL-positive photoreceptor cells. The number of TUNEL-positive cells increased in DMSO-treated and illuminated mice, but it was greatly reduced in flavonoid-treated mice. The statistically different changes are indicated with asterisk (*). Error bars indicate S.D. Statistical analysis was performed with the one-way ANOVA and Dunnett’s post hoc tests. (G and H) RT-qPCR performed on days 1, 3, and 7 after treatment to determine time-related changes of the mRNA expression levels of proapoptotic (BAX) and prosurvival (BCL-2) genes in mouse eyes. Twenty mice were used, with at least four mice for each treatment group. Relative fold change of these genes’ expression was normalized to the expression of GAPDH. The mean of data from three independent experiments is shown as a fold change of NT control. The expression of BAX was upregulated in DMSO-treated and exposed-to-bright-light mice but was significantly downregulated upon treatment with flavonoids. The expression of BCL-2 was slightly downregulated in DMSO-treated and exposed-to-bright-light mice but was significantly upregulated upon treatment with flavonoids. The statistically significant changes in the expression of BAX and BCL-2 compared between DMSO-treated and flavonoid-treated mice on different days are indicated with (*). The nonstatistically different changes are indicated as NS. Error bars indicate S.D. Statistical analysis was performed for each gene separately, combining data for all days, using the multivariate two-way ANOVA analysis and Turkey’s post hoc tests. (I) Eye cryo-sections were stained with an antibody against BAX protein. White arrows indicate the expression of BAX signal in the ONL and inner segments (ISs) (red). BAX positive staining was increased in mice treated with DMSO vehicle and exposed to light as compared with unilluminated mice. Treatment with flavonoids mitigated the expression of BAX. Nuclei were stained with DAPI (blue). Scale bar, 50 µm. D, treated with DMSO vehicle; M, treated with myricetin; NT, nontreated; Q, treated with quercetin.
