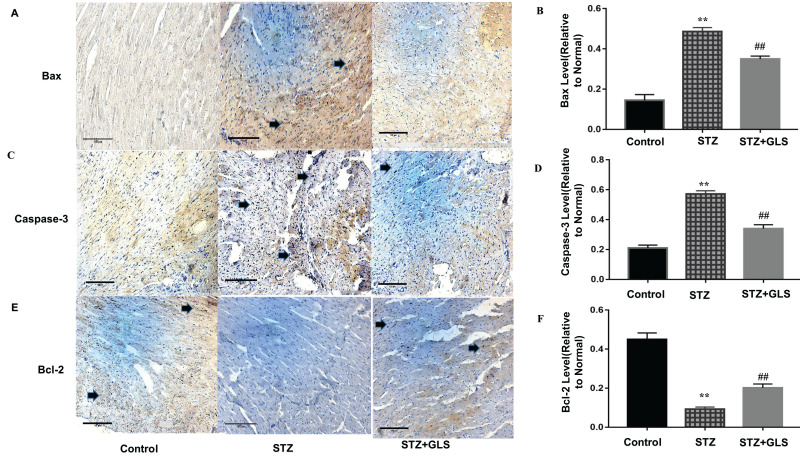
Figure 6.
Effect of Ganoderma lucidum spores (GLS) on the protein expression of Bax, caspase 3 and Bcl-2 in cardiac tissues according to immunohistochemical micrographs (A, C, E), magnification 200×, arrows indicate the areas changed, and respective statistical analysis (B, D, F). Values represent the mean ± SE; n = 3 in each group. **, p < 0.01 versus the control group and ##, p < 0.01 versus the STZ group using Tukey’s test. Control: 5 mL/kg saline (p.o.); Diabetic: 50 mg/kg streptozotocin (i.p.) and 5 mL/kg saline (p.o.); STZ + GLS: 50 mg/kg streptozotocin (i.p.) and 300 mg/kg GLS (p.o.).

