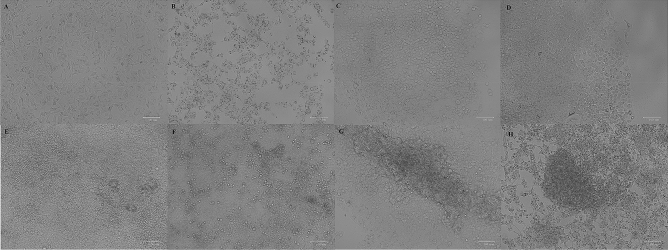
Figure 2.
Morphological changes during TAM-R development using two approaches, (A) control MCF-7 cells without any tamoxifen treatment. Figures (B), (C), (D) and (E) represent MCF-7 cells treated with 30, 40, 45 and 50 μM tamoxifen from the first approach, respectively. MCF-7 cells treated with tamoxifen (F) 35 μM two times, (G) 35 μM four times and (H) 35 μM six times in the second approach. Images were taken using ZOE Fluorescent Cell Imager (Bio-Rad, USA) (Scale bar 100 μm).

