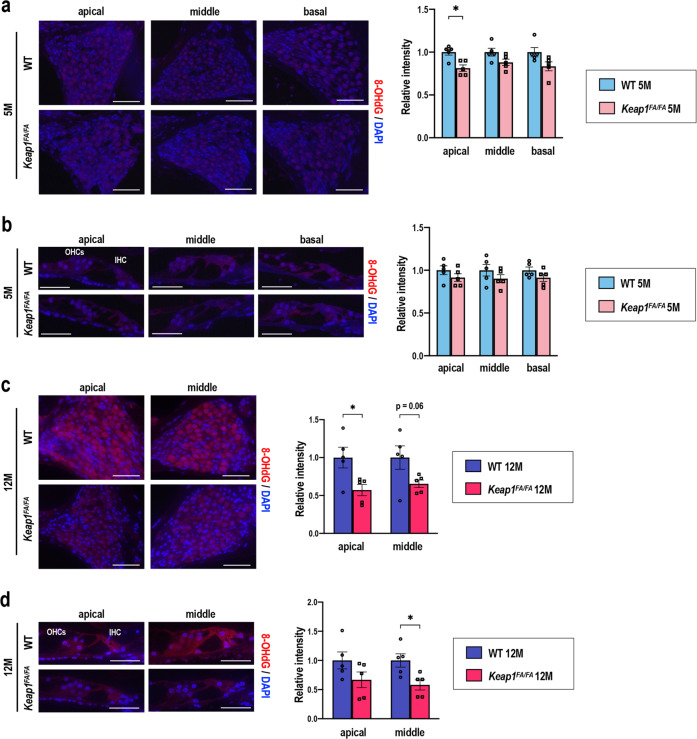
Fig. 12. Accumulation of 8-OHdG in the WT and Keap1FA/FA cochleae at 5 and 12 months of age.
Immunofluorescence detection of 8-OHdG in the SGNs (a, c) and hair cells (b, d) at each turn in the Keap1FA/FA and WT mice at 5 (a, b) and 12 (c, d) months of age. 8-OHdG signals are shown as red fluorescence. Nuclei were counterstained with DAPI (blue). OHCs, outer hair cells; IHC, inner hair cell. The experiments were performed for five samples in each group. Relative intensities of the 8-OHdG signals at each turn were semi-quantified. Average staining intensities of WT mice are set as 1. The data represent the mean ± SEM. *P < 0.05. Unpaired two-tailed Student’s t-test was applied. Scale bars correspond to 50 μm (a, c) and 20 μm (b, d).

