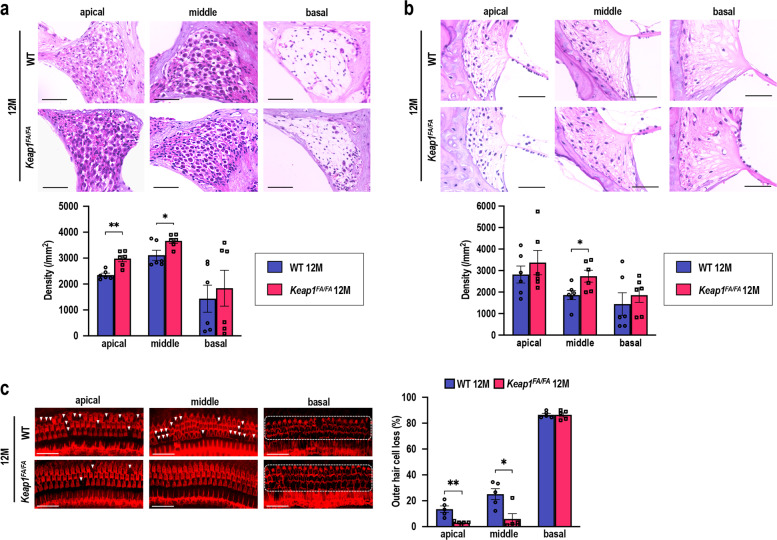
Fig. 8. Comparison of cochleae in the WT and Keap1FA/FA mice at 12 months of age.
a, b Cochlear histology at each turn. The SGN density (a) and density of the SL fibrocytes (b) are shown (n = 6 in each group). c Images of the surface preparation of the hair cells. Missing OHCs are indicated with white arrowheads. Almost all OHCs at the basal turns are missing, as indicated by the area circumscribed by the dashed line. Missing OHCs were quantitatively analyzed by evaluating 90 OHCs at each turn (n = 5 in each group). Data represent the mean ± SEM. *P < 0.05, **P < 0.01. Unpaired two-tailed Student’s t-test was applied. The samples of the WT mice at 12 months of age are the same as those shown in Fig. 2. Scale bars correspond to 50 μm (a, b) and 40 μm (c).

