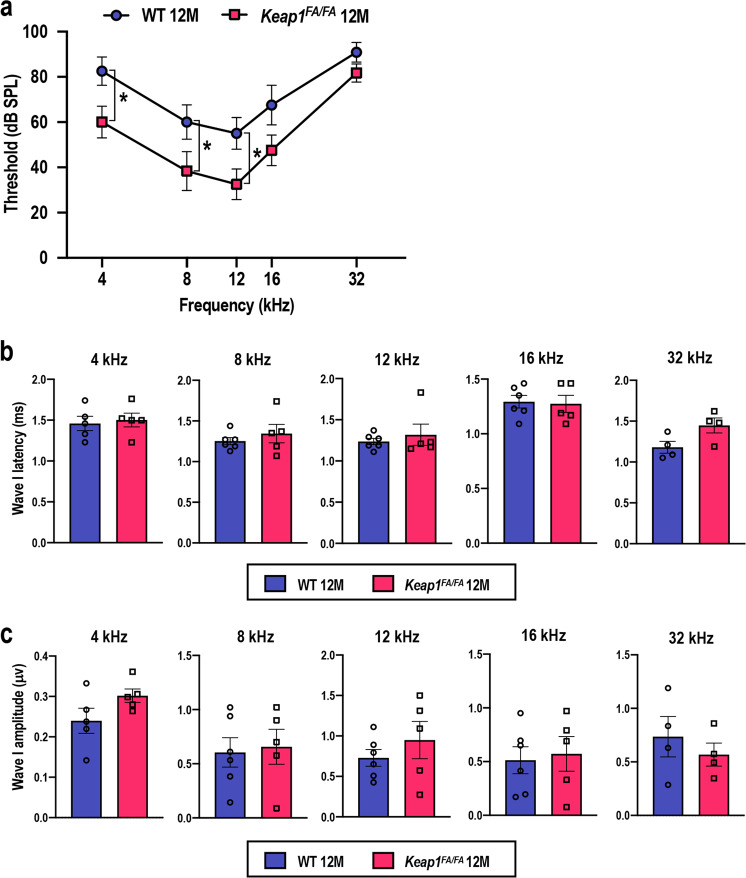
Fig. 9. Comparison of ABR of the WT and Keap1FA/FA mice at 12 months of age.
ABR thresholds (a, n = 6 for each group), ABR wave I latencies (b, n = 6 for WT mice and n = 5 for Keap1FA/FA mice), and ABR wave I amplitudes (c, n = 6 for WT mice and n = 5 for Keap1FA/FA mice) of the WT and Keap1FA/FA mice at the age of 12 months. One and two WT mice that exhibited ABR thresholds above 100 dB SPL at 4 and 32 kHz, respectively, were omitted from the waveform analysis shown in b and c. Likewise, one Keap1FA/FA mouse that exhibited an ABR threshold above 100 dB SPL at 32 kHz was omitted from the waveform analysis shown in b and c. The data represent the mean ± SE. *P < 0.05. Unpaired two-tailed Student’s t-test was applied. The samples of the WT mice at 12 months of age are the same as those shown in Fig. 1.

