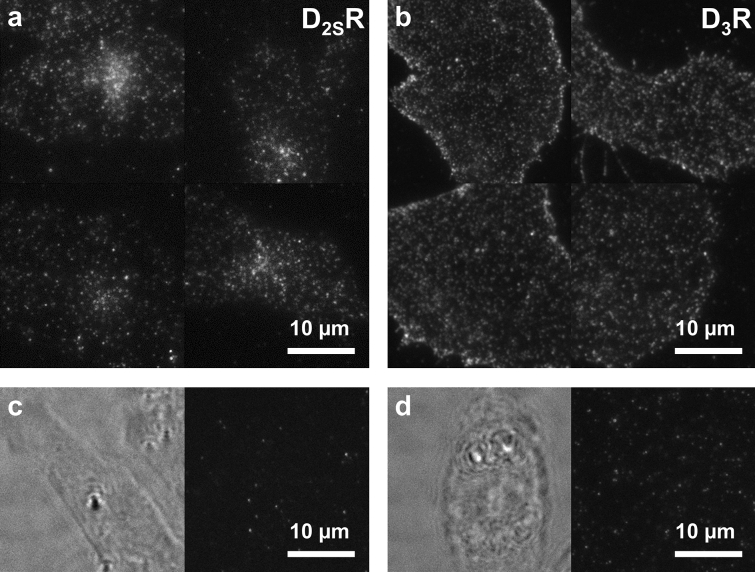
Figure 3.
TIRF microscopy imaging with fluorescent ligand 10b. TIRF images of CHO cells stably expressing (a) D2SR or (b) D3R labeled with 10b (10 nM for D2SR, 1 nM for D3R) visualize the receptor distribution on the cell surface and demonstrate the suitability of the fluorescent ligand for high resolution fluorescence microscopy. (c, d) Validation of specific labeling: representative brightfield (left) and TIRF images (right) of a CHO cell stably expressing (c) D2SR or (d) D3R, preincubated with the D2/3R antagonist spiperone (10 μM) and treated with 10b (10 nM) show only a few non-specifically adhered, immobile fluorescent spots and no cell-specific labeling.

