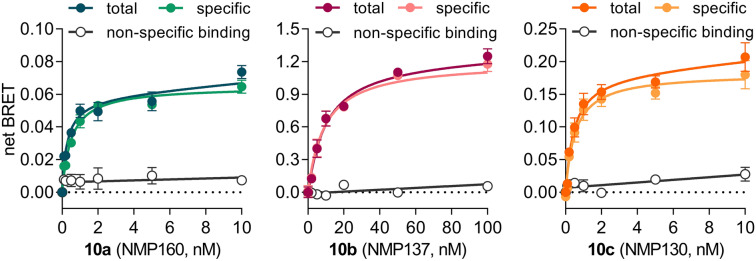
Figure 5.
NanoBRET saturation curves for the fluorescent ligands 10a-c. Saturation binding experiments were performed with live HEK293T cells expressing secNluc-D3R and the fluorescent ligands 10a, 10b and 10c, comprising a trifluorethyl-rhodamine derivative, a Cy3B and an Alexa488 fluorophore, respectively. Non-specific binding was determined in the presence of 10 µM haloperidol. Data points show mean ± SEM of one representative out of n = 5 (for 10a) or n = 4 (for 10b,c) experiments, with each condition carried out in triplicate. The netBRET signal was calculated as the difference between total BRET and the signal obtained in the absence of a fluorescent ligand.

