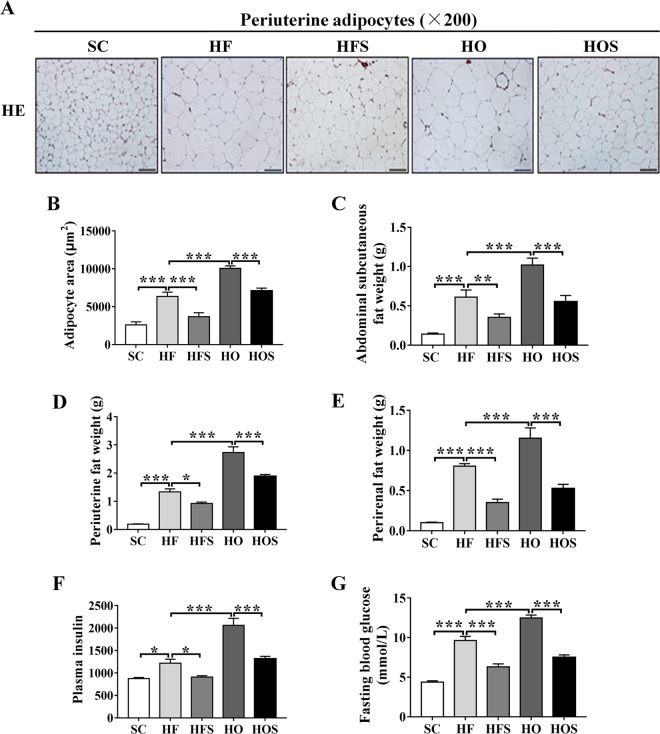
Fig. 2. Salubrinal reduced adipocyte tissue mass.
a Representative H&E staining images showing salubrinal effect in periuterine tissue (200×; scale bar = 100 μm; all graphics were in a blinded fashion). b Area of adipocytes. c Abdominal subcutaneous fat weight. d Periuterine fat weight. e Perirenal fat weight. f Serum insulin. g Fasting glucose. All values were reported as mean ± SEM (n = 10/groups and images were taken randomly). The asterisks (*, **, and ***) represent P < 0.05, P < 0.01, and P < 0.001, respectively.

