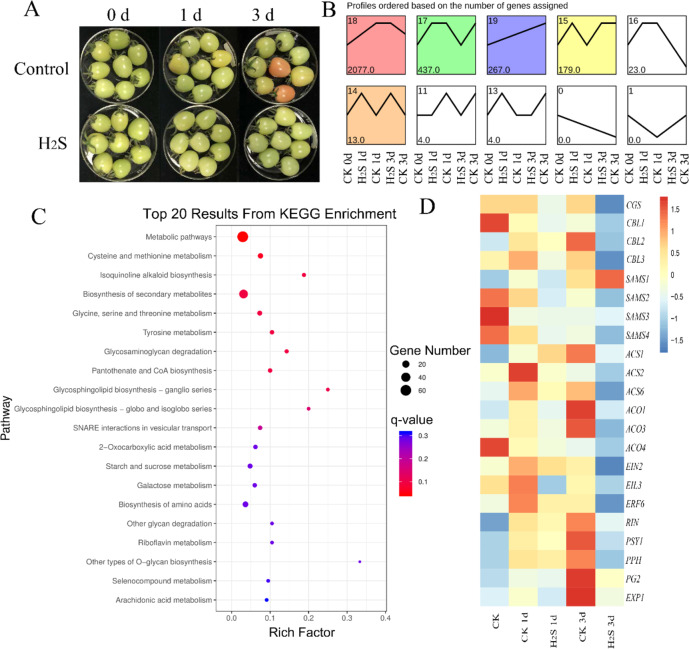
Fig. 7. Transcriptomic analysis of tomato fruit treated with H2S (H2S) or the control (CK) for 0, 1, and 3 days.
A Images of tomato fruit with H2S (H2S) or the control (CK) for 0, 1, and 3 days. B Differential gene expression pattern analysis based on transcriptomic data. C KEGG analysis based on the genes in profile 17 as shown in B. D Heatmap of gene expression data of ripening-related genes in tomato fruit treated with H2S (H2S) or the control (CK) for 0, 1, and 3 days

