Figure 4.
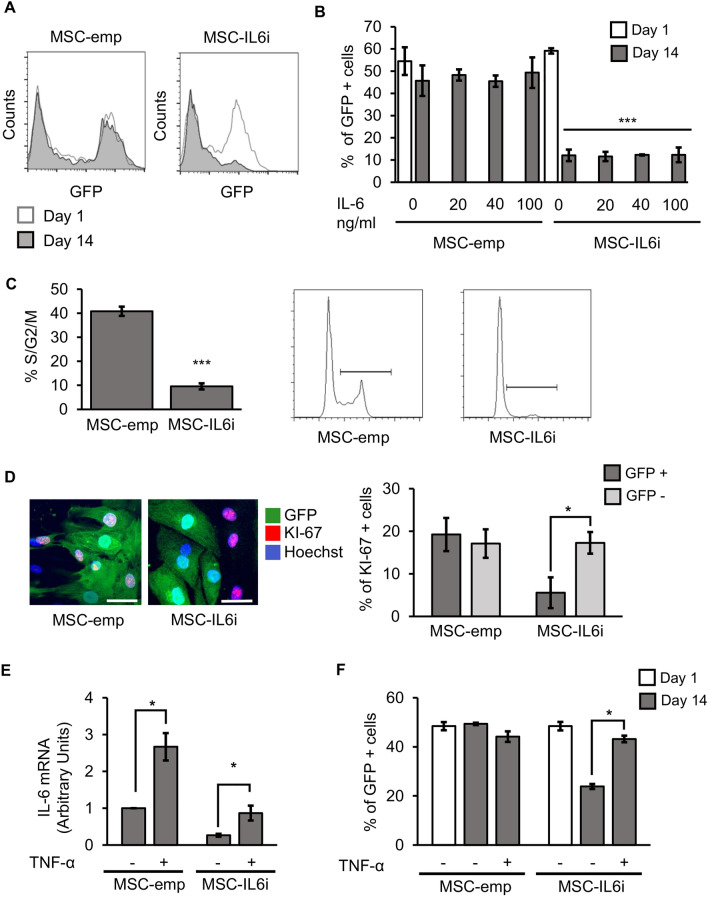
IL-6 silencing blocks cell division. (A) Representative flow cytometry analysis of hMSC-emp or hMSC-IL6i cells. (B) Percentage of GFP+ cells transduced in hMSC-emp or hMSC-IL6i cells, maintained in culture for 1 or 14 days in presence of different concentrations of recombinant IL-6. The histogram shows the mean and SD of 3 independent experiments. White bars % of GFP+ cells at day 1; dark grey bars % of GFP+ cells at day 14. ***p < 0.001. (C). Representative flow cytometry analysis of DNA quantification and quantification of DNA content of hMSC-emp or hMSC-IL6i cells, stained with propidium iodide and analyzed by flow cytometry. ***p < 0.001. (D) Representative images of the immunodetection of KI-67 in hMSC-emp or hMSC-IL6i cells. Green: GFP; Red: KI-67; Blue: Hoechst 33,258. The scale represents 50 μm (left panel). Quantification of % of hMSC KI-67+ in different cell subpopulations of hMSC-emp or hMSC-IL6i cultures. Dark grey: hMSC GFP+ . Light Grey: hMSC GFP− . *p < 0.05. (E) Increasing the intracellular levels of IL-6 by TNF-α stimulation recovers hMSC-IL6i proliferation. Quantification of IL-6 mRNA expression in different hMSC populations treated ( +) or not ( −) with TNF-α (15 ng/ml). The expression levels of the target gene were normalized against GAPDH expression. (F) Percentage of GFP+ hMSC-emp or hMSC-IL6i cells treated with standard medium ( −) or standard medium supplemented with TNF-α ( +) (15 ng/ml) for 2 weeks. White bars: % of GFP+ cells at day 1. Dark grey bars: % of GFP+ cells at day 14. *p < 0.05.

