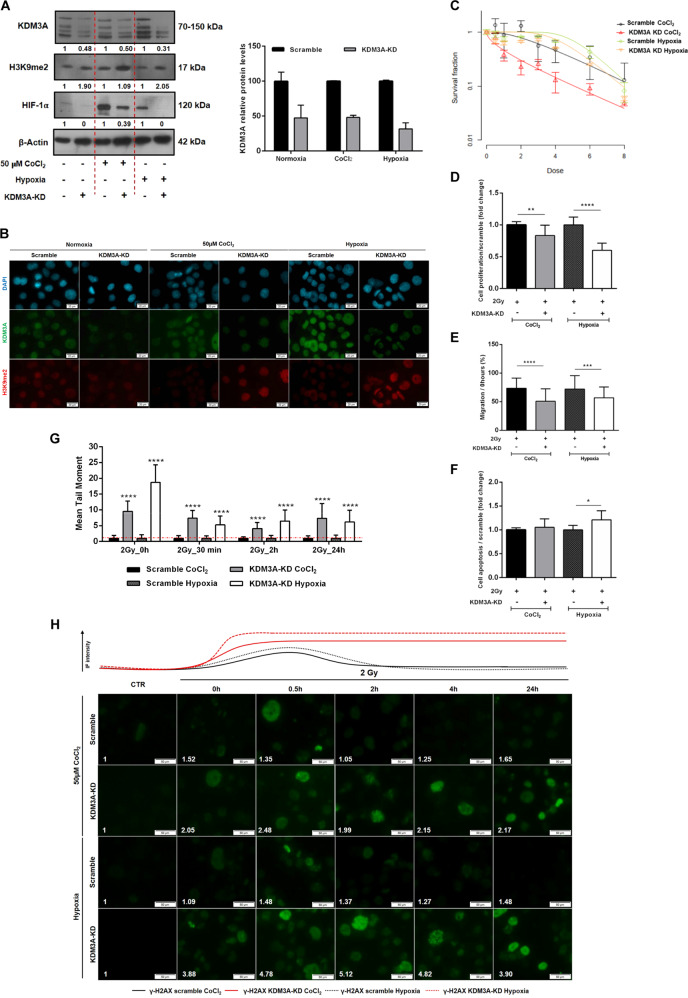
Fig. 4. Radiosensitizing effect of KDM3A knockdown in Kyse-410 ESCC cell line.
a Representative images of total protein levels of KDM3A (70–150 kDa), H3K9me2 (17 kDa), and HIF-1α (120 kDa) in KDM3A knockdown compared with scramble under normoxia and hypoxic conditions (50 µM CoCl2 or 0–1% O2). β-Actin (42 kDa) was used as loading control. b Representative IF pictures of co-localized nuclear DAPI (blue), KDM3A (green), and H3K9me2 (red) in KDM3A-KD and scramble, under normoxia and hypoxic conditions (50 µM CoCl2 or 0–1% O2). All pictures were taken with Olympus IX51 microscope at ×200 magnification (scale bar 50 μm). c Cell survival curves from Kyse-410 KDM3A-KD/Scramble cell lines irradiated with [0–8] Gy range IR dose fraction under 50 µM CoCl2 and 0.5–1% O2 hypoxic conditions through SHMT model analysis. Results are presented as mean ± SD of at least three independent experiments. d Cell proliferation (e) 24 h migration normalized to 0H and (f) cell apoptosis for combined KDM3A-KD/Scramble + 2 Gy irradiation under hypoxic conditions (50 µM CoCl2 or 0–1% O2). Fold changes were obtained after 2 Gy/0 Gy normalization. Results are represented as mean ± SD of at least three independent experiments; *p < 0.05; **p < 0.01; ***p < 0.001; ****p < 0.0001. g DNA damage of 2 Gy irradiated Kyse-410 KDM3A-KD/Scramble cells between 0 and 24 h 50 µM CoCl2 and hypoxia (0.5–1% O2), by comet assay. Results refer to the mean values of at least 50 comets per condition. All values of DNA fragmentation (tail moment) were normalized to control (0 Gy). Fold change of relative values KDM3A-KD were compared to control scramble. h Representative pictures of nuclear γ-H2AX staining of 2 Gy irradiated Kyse-410 KDM3A-KD/Scramble cells (0–24 h) under 50 µM CoCl2 and hypoxia (0.5–1% O2). All pictures were taken with Olympus IX51 microscope at ×200 magnification (scale bar 50 μm). IF quantification was done using ImageJ software (version 1.6.1, from National Institutes of Health) and represented as a fold change between 2 Gy irradiated cells and non-irradiated control. IF, fluorescence intensity.

