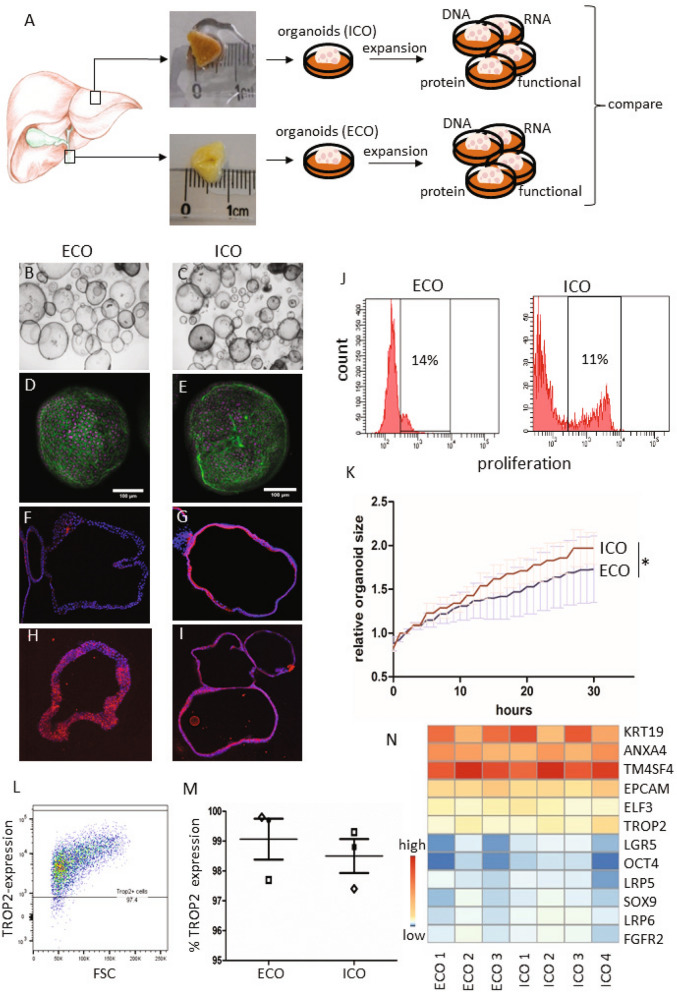
Figure 1.
Culture initiation and characteristics of liver- and extrahepatic bile duct-derived organoids. Schematic representation of organoid culture initiation from liver biopsies (intrahepatic bile duct; iDO) and extrahepatic bile duct (eDO) (A). Organoids were cultured and passaged weekly (1:3 for over 30 passages/ > 8 mo) and harvested at different passages for further analysis. ECO were cultured as efficiently as liver-derived ICO. Both look similar at the microscopic level (B, C), when stained with phalloidin/DAPI (D,E), and in FFPE sections stained by immunofluorescent KRT7 (F,G—10×) and KRT19 (H,I—10×). EdU-incorporation showed a similar percentage of proliferating cells (11–14% in S-phase) in both organoid types at passage 10. Shown is one representative result of three paired donor lines tested (J). The individual percentages are shown in Supplemental Fig. S2. Despite no significant difference in proliferation (p = 0.122), a significant difference in organoid size was found when analyzing individual organoids for 30 h (K) Shown is mean ± SEM of 100 organoids from paired ECO and ICO of three different donors. TROP2 protein expression was found in almost 100% of the organoid cells, both for ECO and ICO (L,M) (three paired organoid lines). Expression heatmap of selected genes described by Aizarani et al., as markers for liver progenitors15. The expression levels per gene were collected from the normalized RNA sequencing analysis performed on four ICO and three ECO lines, and visualized as Z-score. Though the level of expression varied per gene, no significant difference in expression was found between ICO and ECO (N).

