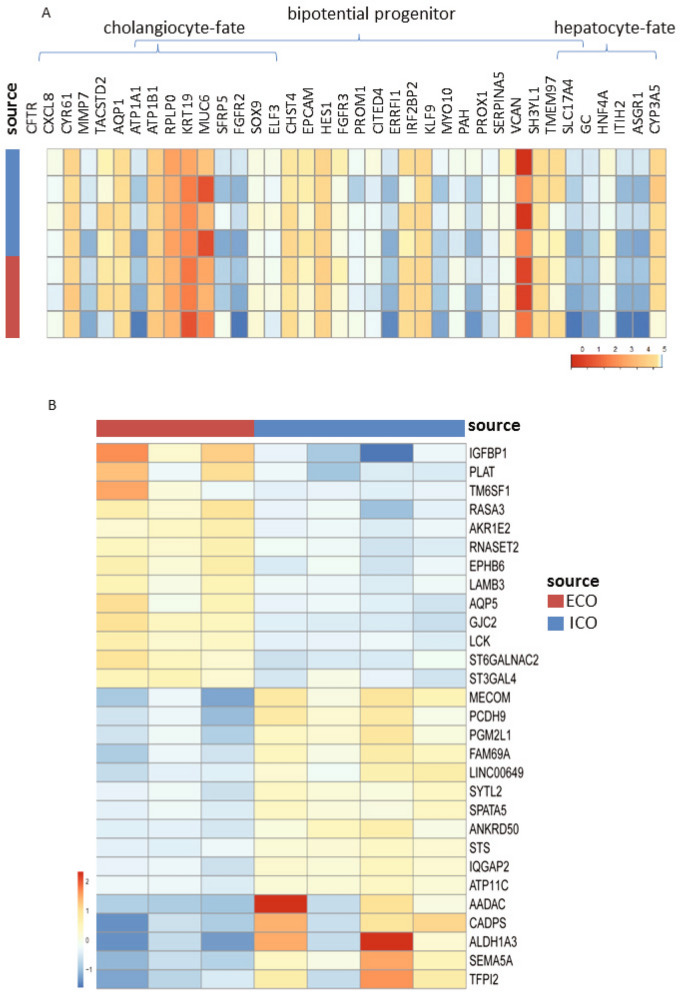
Figure 2.
Limited differences in gene expression between ECO and ICO. Gene expression analysis of three paired ICO and ECO and one additional ICO line was performed using RNAseq. Selected genes, as described by Aizarani et al.15 that are expressed in EpCAM-positive cells and associated with progenitors, hepatocyte-fate or cholangiocyte-fate. Shown are normalized (bulk) RNA sequencing results of the undifferentiated ECO and ICO for this specific gene set. Expression of the progenitor, hepatocyte-fate- and cholangiocyte-fate associated genes was similar between ECO and ICO. The expression heatmap shows Z-scores that are color-coded as shown (A). No significant differences between ICO and ECO for this gene set was observed. The expression heatmap (B) indicates clusters of genes that are differentially expressed (29 in total, p adjusted < 0.05), 13 higher expressed in ECO and 16 higher in ICO. This analysis reveals that although both organoid types are very similar in gene expression profiles, there are some differences albeit in a relatively low number of genes.

