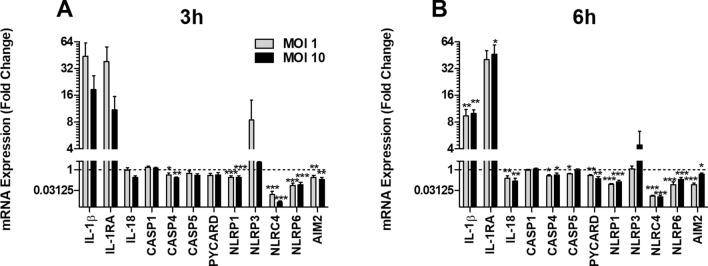
Figure 1.
Gene expression of inflammasome-related genes. Human neutrophils were infected with UPEC strain CFT073 at MOI 1 or MOI 10 for 3 h (A) and 6 h (B) followed by analysis of mRNA expression. The gene expression was normalized to GAPDH and expressed as fold change relative to unstimulated controls. Data are presented as mean ± SEM (n = 3 independent experiments) with the y-axis as Log2. Bars below 1 (the dotted line) indicate decreased gene expression. Asterisks denote statistical significance compared to respective unstimulated control (*p < 0.05, **p < 0.01, ***p < 0.001).

