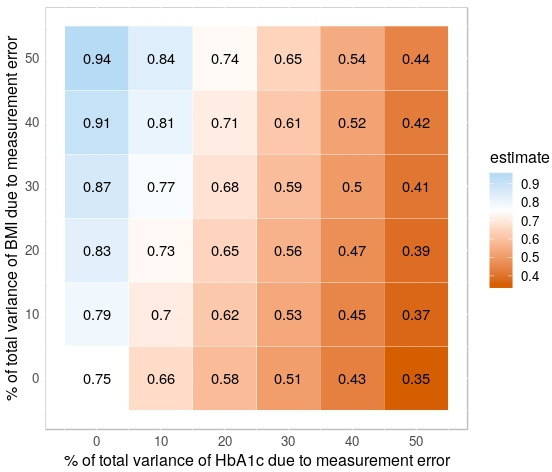
Figure 2.

Estimates of the association between HbA1c levels and systolic blood pressure after adjustment for confounding by BMI under various simulation scenarios characterised by different levels of measurement error. Numbers represent effect estimates averaged over 1000 simulation repetitions. Red shading represents low (averaged) estimates. Blue shading represents high (averaged) estimates. CIs are omitted for clarity. See text for details. BMI, body mass index; HbA1c, glycated haemoglobin.
