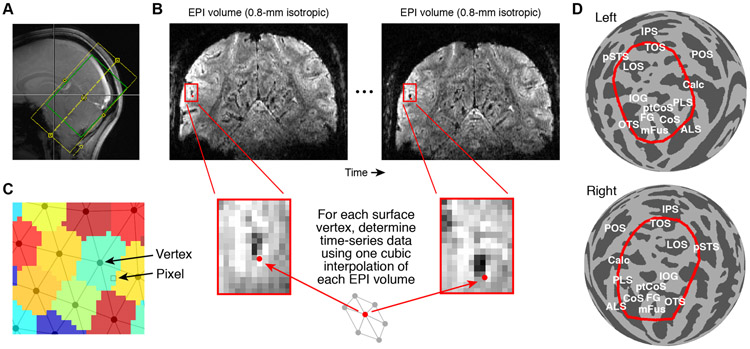
Figure 1. Schematic of fMRI analysis methods.
A, Example slice prescription used for sub-millimeter fMRI. B, Pre-processing of functional data. Two operations are performed. EPI volumes are temporally resampled (cubic interpolation of each voxel’s time-series data) to correct for differences in slice acquisition times and to achieve a desired sampling rate. The EPI volumes are then spatially resampled (cubic interpolation of each volume) onto cortical surface vertices (see Figure 2). The spatial operation compensates for head motion, EPI distortion, and registration between functional and anatomical data. The depicted schematic shows how different acquired EPI volumes are mapped onto a single surface vertex. C, Visualization of surface-based data. Surface vertices are orthographically projected to the image plane, and each image pixel is assigned the value associated with the nearest vertex. This nearest-neighbor approach avoids blurring and is computationally efficient. D, Region-of-interest (ROI). For summarizing results in this paper, we define and use an fsaverage ROI (red outline) that captures visually responsive cortex (see Methods for details).

