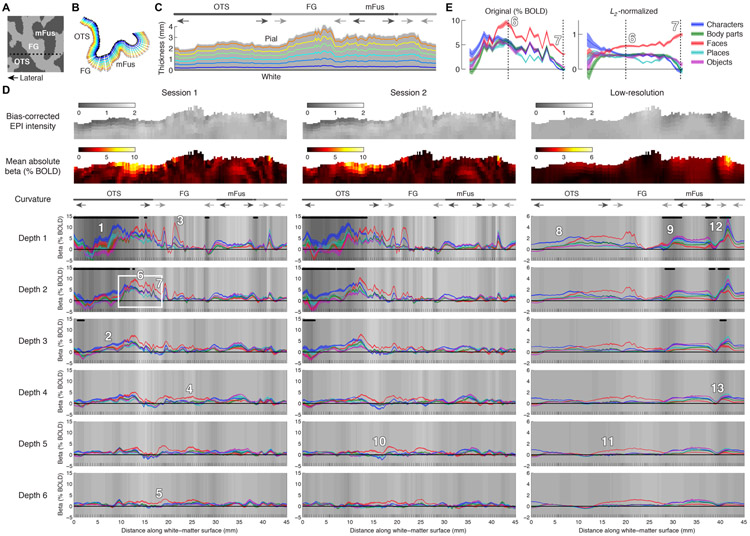
Figure 11. Line profiles demonstrate reliability of fine-scale BOLD activity patterns.
A, Location of line. The dotted line indicates the sequence of vertices (line) selected for this figure (Subject S1, right hemisphere, flattened ventral temporal cortex). B, Position of vertices in native 3D space. C, Cross-sectional view of cortex. Vertices are arranged along the x-axis as in panel D. Light and dark arrows indicate compression and expansion of outer depths (as in Figure 4B). D, Line profiles of BOLD activity measured in two independent high-resolution 0.8-mm 7T scan sessions (1st and 2nd columns) and in a low-resolution 2.4-mm 3T scan session (3rd column). Tick marks on the x-axis indicate cumulative Euclidean distance of the vertices in the white-matter surface. Background shading indicates bias-corrected EPI intensity and black dots mark vertices that fall below the 0.75 threshold. Ribbons indicate the amplitude of the BOLD response (beta weight) evoked by different stimulus categories, with ribbon width indicating the standard error across trials. E, Detailed view of line profiles highlighted in panel D. The L2-normalized plot is obtained by dividing the beta weights observed at each vertex by their vector length.

