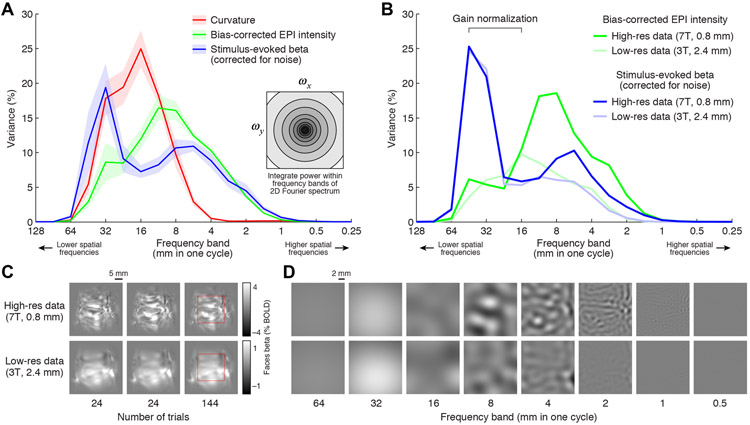
Figure 12. Quantification of spatial frequency content.
After applying a Hanning window, we perform a Fourier transform of values placed on a section of flattened ventral temporal cortex and express the power in different spatial frequency subbands as a percentage of the total summed power (see Methods). A, Summary of results. Each ribbon indicates the mean and standard error across subjects. The red line shows results for unthresholded curvature values; the green line shows results for bias-corrected EPI intensities from Depth 1; and the blue line shows results for BOLD response amplitudes (beta weights). B, Results at high- vs. low-resolution (Subject S1). To facilitate comparison, the low-resolution results are scaled to match (in a least-squares sense) the high-resolution results over the indicated range of low-frequency subbands. C, Example BOLD activity patterns (Subject S1, right hemisphere, ‘faces’ stimulus category). Images show independent measurements (first two columns, 24 trials per measurement) or the average across all measurements (third column, 144 trials). D, Illustration of band-pass decomposition for the region marked with a red square in panel C. For visibility, images have been contrast-enhanced (colormap range is 1/3 of the range in panel C).

