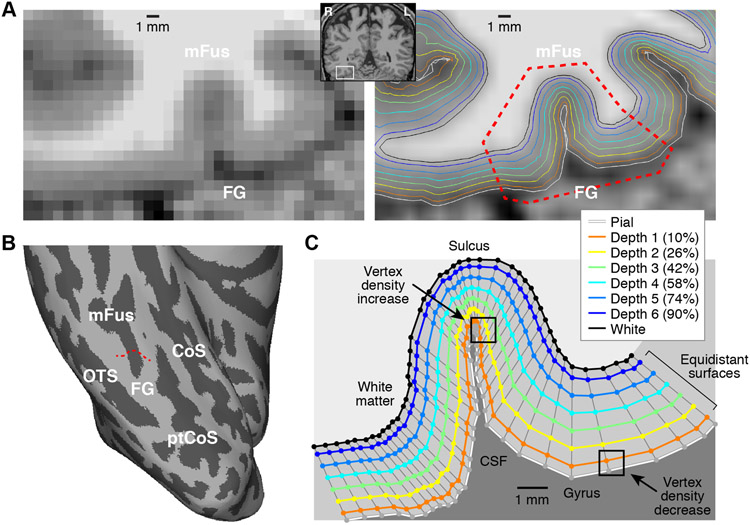
Figure 2. Cortical surface representations.
Cortical surface representations were generated using FreeSurfer applied to a 0.8-mm T1 volume. Six surfaces were created equally spaced between 10% (Depth 1) and 90% (Depth 6) of the distance between the pial and white-matter surfaces, and edges were bisected to increase vertex density. A, Detailed view of surface results (Subject S1). On the left is the T1 volume; on the right is a smoothed version of the T1 volume with surfaces overlaid. B, Ventral view of inflated right hemisphere. The red dotted line in panel B corresponds to the cortical cross-section marked by red dotted lines in the right side of panel A. C, Visualization of surface vertices. Each colored line corresponds to the vertices marked by the red dotted line in panel B. Thin gray lines join corresponding vertices across surfaces. For surfaces positioned at inner cortical depths (e.g. White, Depth 6), vertex density is relatively homogeneous, but for surfaces positioned at outer cortical depths (e.g. Pial, Depth 1), vertex density varies depending on local cortical curvature.

