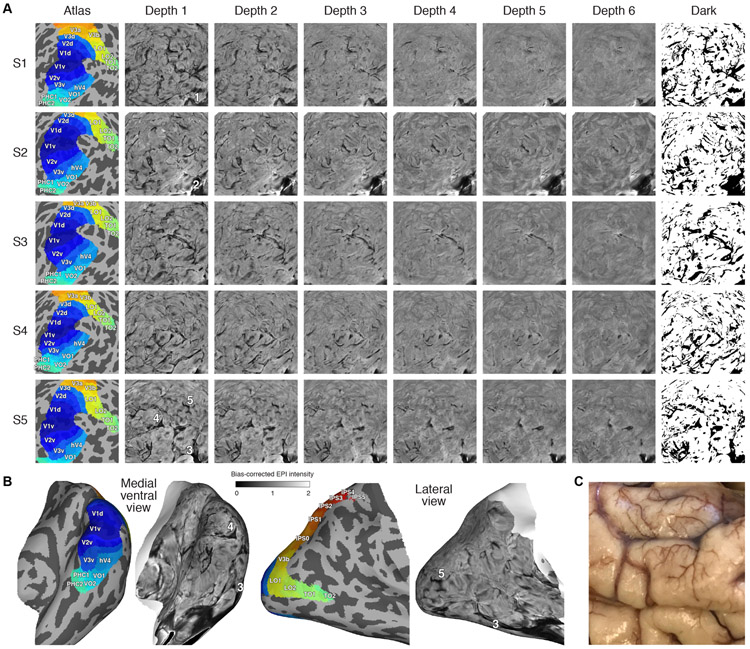
Figure 5. Comprehensive view of static susceptibility effects.
A, Bias-corrected EPI intensities (posterior view, spherical surface, right hemisphere). The colormap for each image ranges from 0–2, as in Figure 9B. In the last column, black indicates intensities less than 0.75 in at least one of the depths (for details on the threshold, see Figure 6). All subjects exhibit a complex, fine-scale pattern of susceptibility. For an intuitive movie that conveys the depth-dependence of the susceptibility effects, see Supplementary Movie 5. B, Results shown on the inflated right hemisphere (Subject S5, Depth 1). C, Photograph of postmortem adult male cortex (courtesy of K. Grill-Spector). The spatial structure of the vasculature visible here resembles the susceptibility observed in our sub-millimeter fMRI measurements.

