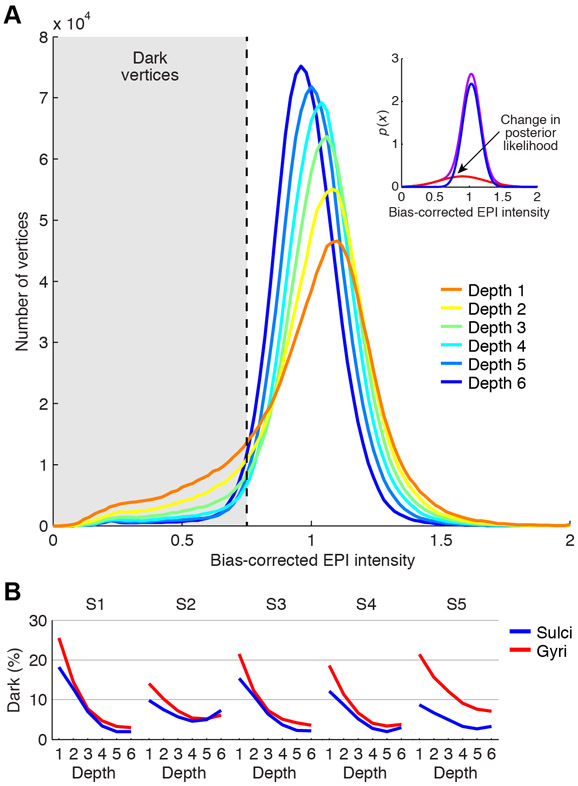
Figure 6. Static susceptibility effects correlate with cortical depth and curvature.
A, Relationship to cortical depth. Depicted are histograms of bias-corrected EPI intensities (aggregated across subjects). The inset shows results of a Gaussian Mixture Model that has been fit to intensities aggregated across subjects and depths (red, blue, and purple indicate the two fitted Gaussian distributions and their sum, respectively). The value at which the posterior probability switches between the two distributions is 0.75, and we use this threshold to determine ‘dark’ vertices. B, Relationship to cortical curvature. The percentage of vertices classified as dark is plotted separately for sulci and gyri. Dark vertices tend to be located at outer depths and in gyri.

