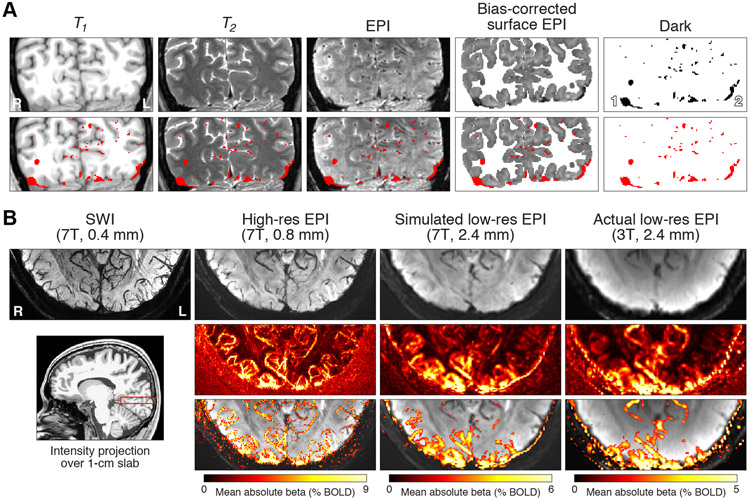
Figure 7. Volume-based visualization of susceptibility effects.
A, Visualization of a coronal slice (Subject S5). In addition to T1, T2, and EPI intensities, we show bias-corrected EPI intensities (transformed from surface to volume) and a thresholded version of these intensities (< 0.75). Thresholded voxels are shown as a red overlay in the second row of images. B, Visualization using intensity projection (Subject S1). We compute the minimum or maximum intensity observed along the superior-inferior dimension for a 1.04-cm slab in occipital cortex (red rectangle). The first row shows minimum intensity projections for an SWI volume acquired at very high resolution, the high-resolution EPI volume from the main experiment, a simulated low-resolution EPI volume obtained by spatially smoothing the high-resolution EPI volume, and an actual low-resolution EPI volume. The second row shows maximum intensity projections for BOLD responses evoked by the experiment. The third row thresholds the images from the second row at 1/3 of the maximum colormap value and superimposes the results on the images from the first row.

