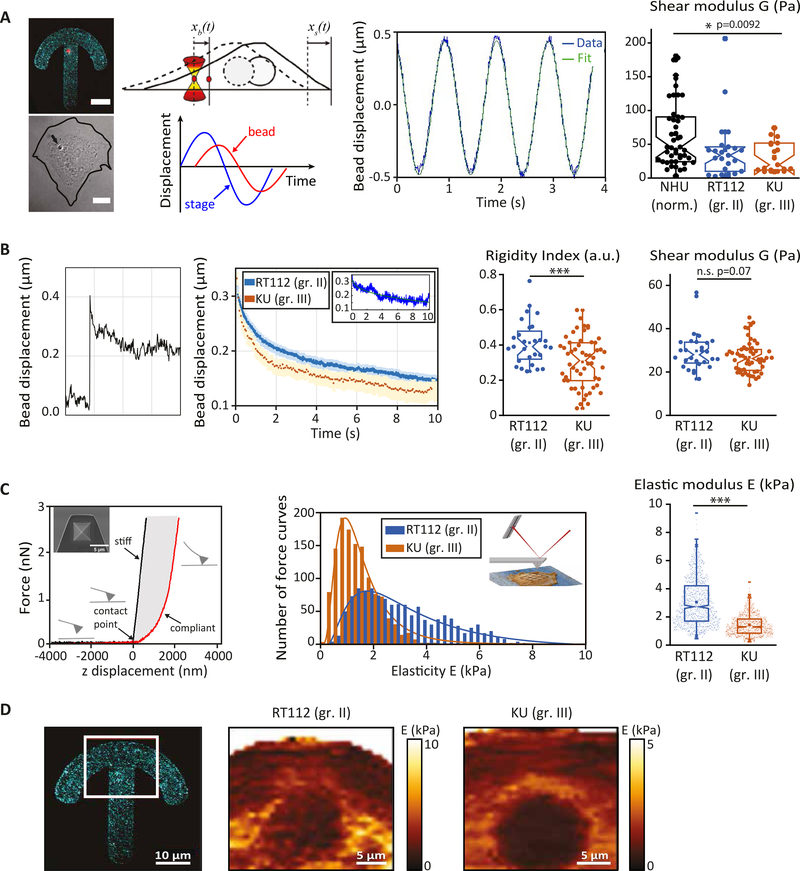
Figure 1: Bladder cancer cells are softer than normal urothelial cells and soften with increasing grade.
(A) Intracellular oscillations experiments. (Left) Typical fluorescent and corresponding brightfield images of a normal human urothelial cell plated on a fibronectin-coated crossbow shape micropattern (cyan) with an internalized bead (red). The line shows the cell contour. Scale bars, 10 μm. (Middle) Cartoon showing the bead initially trapped at the center of the optical tweezers at time t =0 s, while the cell is moved in an oscillatory fashion. Typical oscillatory displacement of the bead and fitting of the curve (see Methods). (Right) Shear modulus measured by intracellular oscillating optical tweezers microrheology in normal urothelial (NHU) cells, grade II (RT112) and grade III (KU) bladder cancer cells. Data are from N=52, 20 and 20 cells for NHU, RT112 and KU cells respectively. Error bars represent standard errors. p-values are determined from Student’s t-test for unpaired samples (*** p<0.0001; * p<0.01). (B) Intracellular relaxation experiments. (Left) Relaxation curves showing the bead displacement from the center of the optical trap as a function of time following a .5 μm step displacement of the stage for RT112 cells (blue) and KU cells (orange). The relaxation strongly depends on the bead microenvironment: a stiff (blue) or soft (orange) microenvironment is characterized by a faster or slower relaxation respectively. The inset shows an example of curve fitting using a power-law model (see Methods). (Right) The bar graphs show the averaged rigidity index and shear modulus of RT112 and KU cells calculated from the relaxation curves using a phenomenological model (for the rigidity index) or a power-law model (for the shear modulus). Data are from N=36 and 60 cells for RT112 and KU cells respectively. Error bars represent standard errors. p-values are determined from Student’s t-test for unpaired samples (*** p<0.0001; * p<0.01). (C) AFM indentation experiments. (Left) Schematic representation of the AFM experiment. A quadratic pyramid geometry tip with an opening angle of 36° has been used for the experiment. Typical single point force-distance curve. Glass was used for calibration. The force increases after the contact point. Glass shows an infinite stiffness (black curve) while a cell is compliant (red curve). (middle) Distribution of the elasticity E for RT112 cells and KU cells. (Right) Averaged elasticity of RT112 cells and KU cells. Data are from N= 60, 60 cells for NHU and KU cells respectively. Error bars represent standard errors. p-values are determined from Student’s t-test for unpaired samples (*** p<0.0001; * p<0.01). (D) Spatial maps of the elasticity E measured on micropatterned cells. (Right) The red box shows the region from which the spatial maps were taken. Scale bar, 10 μm. (Center and left) Single cell stiffness maps of RT112 (center) and KU (right) cells. Scale bars, 5 μm.

